Introduction to gene coverage plots
Often is is usefull to view coverage of a specific region of the genome in the context of specific samples. During initial stages of analysis this can be done with a genome browser such as IGV however when preparing a publication more fine grain control is usefull. For example you may wish to change the coverage scale, reduce the size of introns, or visualize many samples at once. GenVisR provides a function for this aptly named genCov().
Introduction to datasets
In this section we will be using coverage data derived from two mouse samples from the study “Truncating Prolactin Receptor Mutations Promote Tumor Growth in Murine Estrogen Receptor-Alpha Mammary Carcinomas”. We will be showing that the knockout of the STAT1 gene described in the manuscript was successful. In order to obtain the preliminary data we used the command bedtools multicov -bams M_CA-TAC245-TAC245_MEC.prod-refalign.bam -bed stat1.bed to obtain coverage values for the wildtype TAC245 sample and the tumor free knockout TAC265 sample. Go ahead and load this data from the genomdata.org server.
# read the coverage data into R
covData <- read.delim("http://genomedata.org/gen-viz-workshop/GenVisR/STAT1_mm9_coverage.tsv")
Formating coverage data
Before we get started we need to do some preliminary data preparation to use genCov(). First off genCov() expects coverage data to be in the form of a named list of data frames with list names corresonding to sample id’s and column names “chromosome”, “end”, and “cov”. Further the chromosome column should be of the format “chr1” instead of “1”, we’ll explain why a bit later. Below we rename our data frame columns with colnames() and create an anonymous function, a, to go through and split the data frame up into a list of data frames by sample. We then use the function names() to assign samples names to our list.
# rename the columns
colnames(covData) <- c("chromosome", "start", "end", "TAC245", "TAC265")

# create a function to split the data frame into lists of data frames
samples <- c("TAC245", "TAC265")
a <- function(x, y){
    col_names <- c("chromosome", "end", x)
    y <- y[,col_names]
    colnames(y) <- c("chromosome", "end", "cov")
    return(y)
}
covData <- lapply(samples, a, covData)

names(covData) <- samples
loading a BSgenome and TxDb object
The next set of data we need is an object of class BSgenome, short for biostrings genome. These object are held in bioconductor annotation packages and store reference sequences in a way that is effecient for searching a reference. To view the available genomes maintained by bioconductor you can either install the BSgenome package and use the function available.genomes() or you can use biocViews on bioconductors website. We also need to load in some transcription meta data corresponding to our data. This type of data is also stored on bioconductor and is made available through annotation packages as TxDb objects. You can view the available TxDb annotation packages using biocViews. In our situation the coverage data for our experiment corresponds to the mm9 reference assembly, so we will load the BSgenome.Mmusculus.UCSC.mm9 and TxDb.Mmusculus.UCSC.mm9.knownGene libraries. It is important to note that the chromosomes between our data sets must match, UCSC appends “chr” to chromosome names and because we are using these libraries derived from UCSC data we must do the same to our coverage input data.
# install and load the BSgenome package and list available genomes
#if (!requireNamespace("BiocManager", quietly = TRUE))
#    install.packages("BiocManager")
#BiocManager::install("BSgenome", version = "3.8")
library("BSgenome")
available.genomes()

# install and load the mm9 BSgenome from UCSC
#if (!requireNamespace("BiocManager", quietly = TRUE))
#    install.packages("BiocManager")
#BiocManager::install("BSgenome.Mmusculus.UCSC.mm9", version = "3.8")
library("BSgenome.Mmusculus.UCSC.mm9")
genomeObject <- BSgenome.Mmusculus.UCSC.mm9

# Install and load a TxDb object for the mm9 genome
#if (!requireNamespace("BiocManager", quietly = TRUE))
#    install.packages("BiocManager")
#BiocManager::install("TxDb.Mmusculus.UCSC.mm9.knownGene", version = "3.8")
library("TxDb.Mmusculus.UCSC.mm9.knownGene")
TxDbObject <- TxDb.Mmusculus.UCSC.mm9.knownGene
Creating a Granges object
The final bit of required data we need is an object of class GRanges, short for “genomic ranges”. This class is a core class maintained by bioconductor and is the preferred way for storing information regarding genomic positions. In order to use this class we need to install the GenomicRanges package from bioconductor and use the GRanges() constructor function. Let’s go ahead and define a genomic location within this class corresponding to our coverage data.
# get the chromosome, and the start and end of our coverage data
chromosome <- as.character(unique(covData[[1]]$chromosome))
start <- as.numeric(min(covData[[1]]$end))
end <- as.numeric(max(covData[[1]]$end))

# define the genomic range
grObject <- GRanges(seqnames=c("chr1"), ranges=IRanges(start=start, end=end))
Creating an initial coverage plot
Now that we have all the basic inforamation we need let’s go ahead and pass all of this information to genCov() and get an initial coverage plot. We will also use the parameter cov_plotType so that the coverage is shown as a line graph, this is a matter of personal preference and may not be suitable is the coverage values vary widly from base to base. Other values cov_plotType accepts are “bar” and “point”.
# create an initial plot
genCov(x=covData, txdb=TxDbObject, gr=grObject, genome=genomeObject, cov_plotType="line")
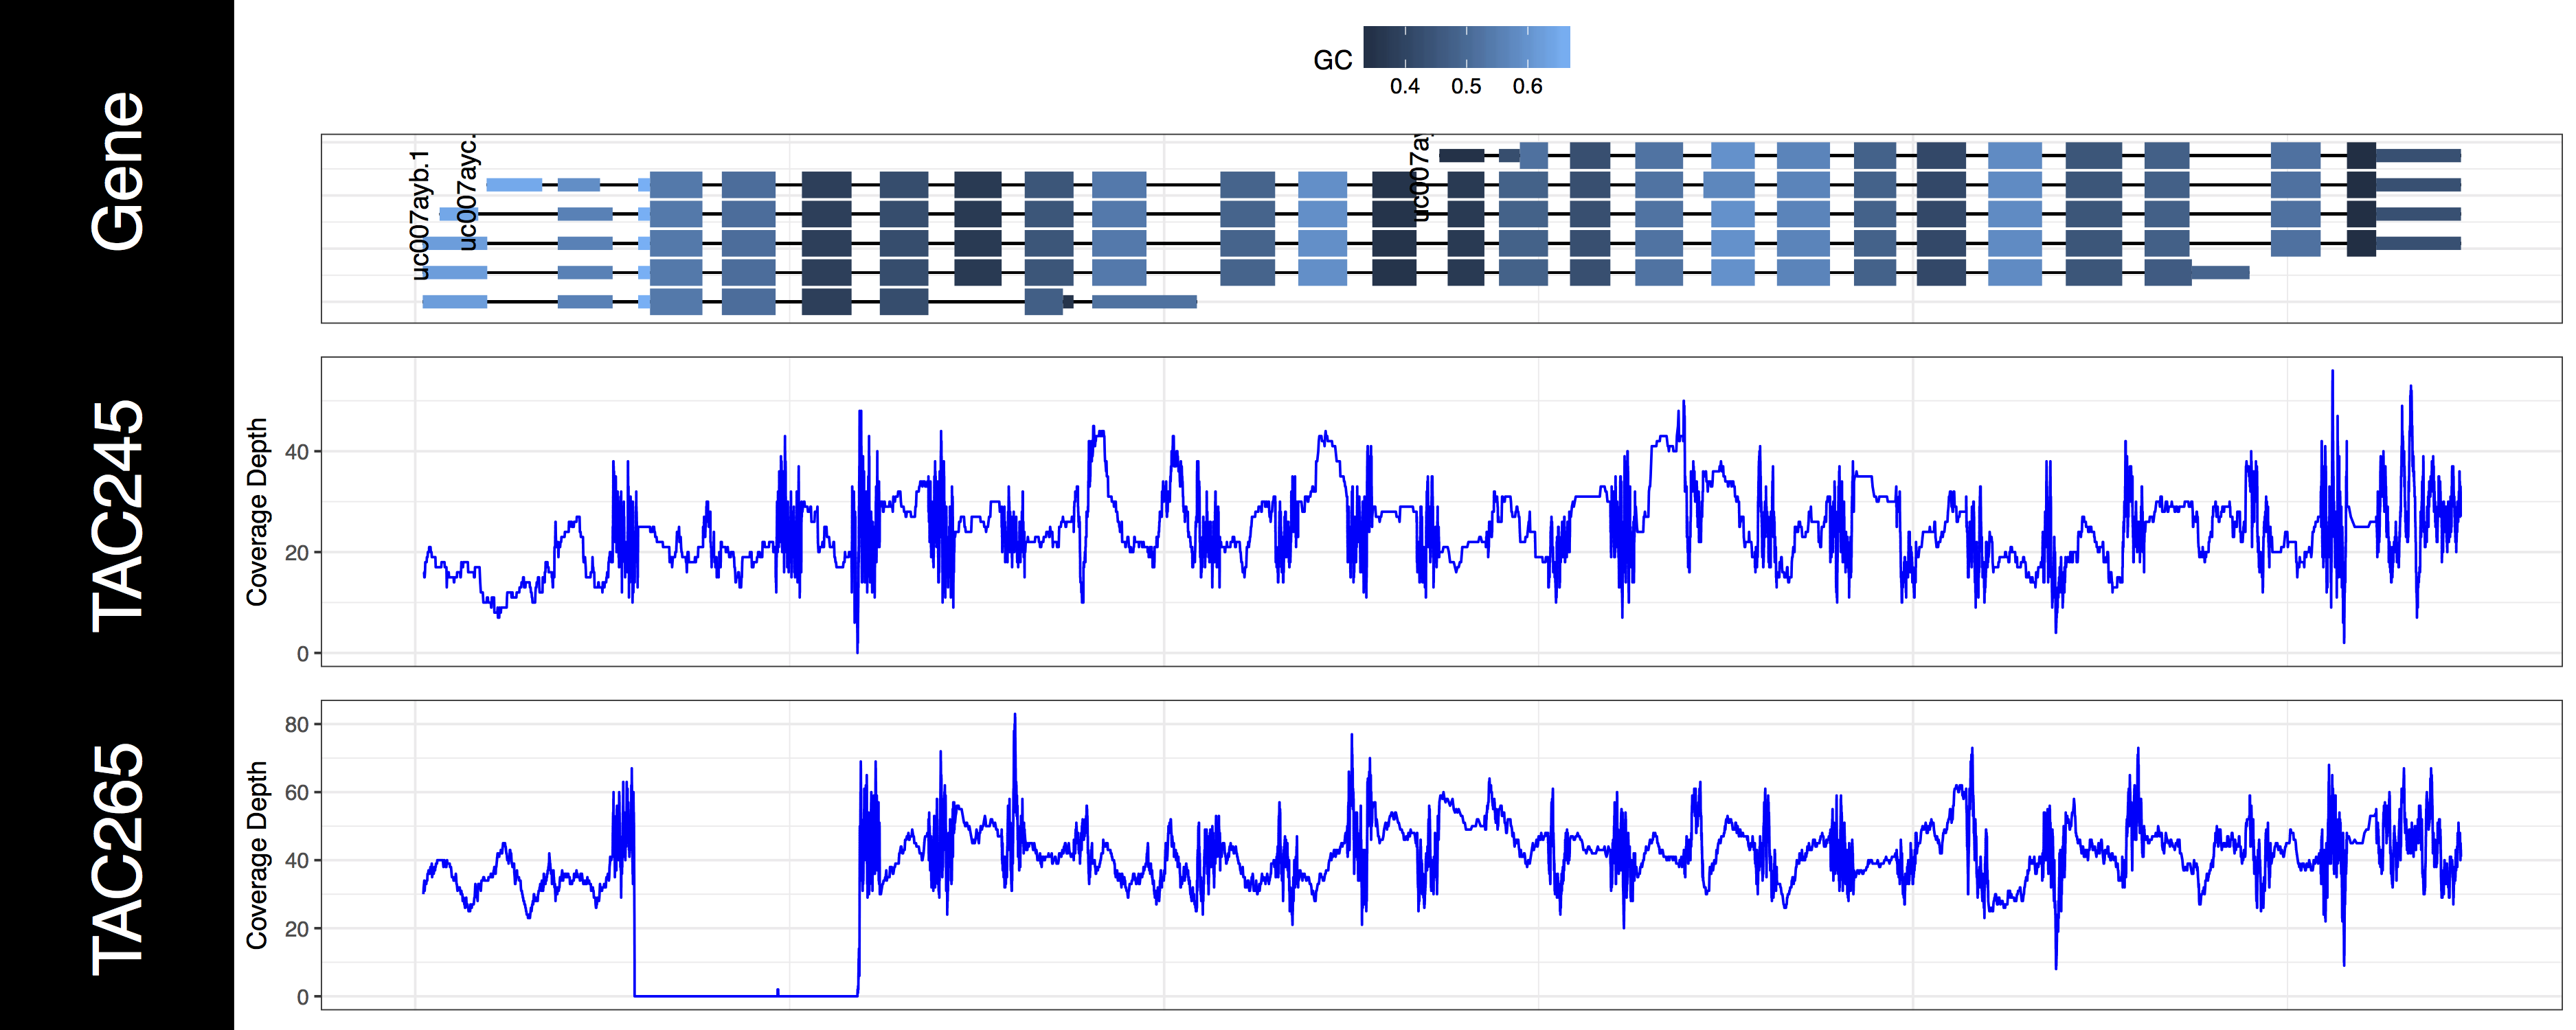
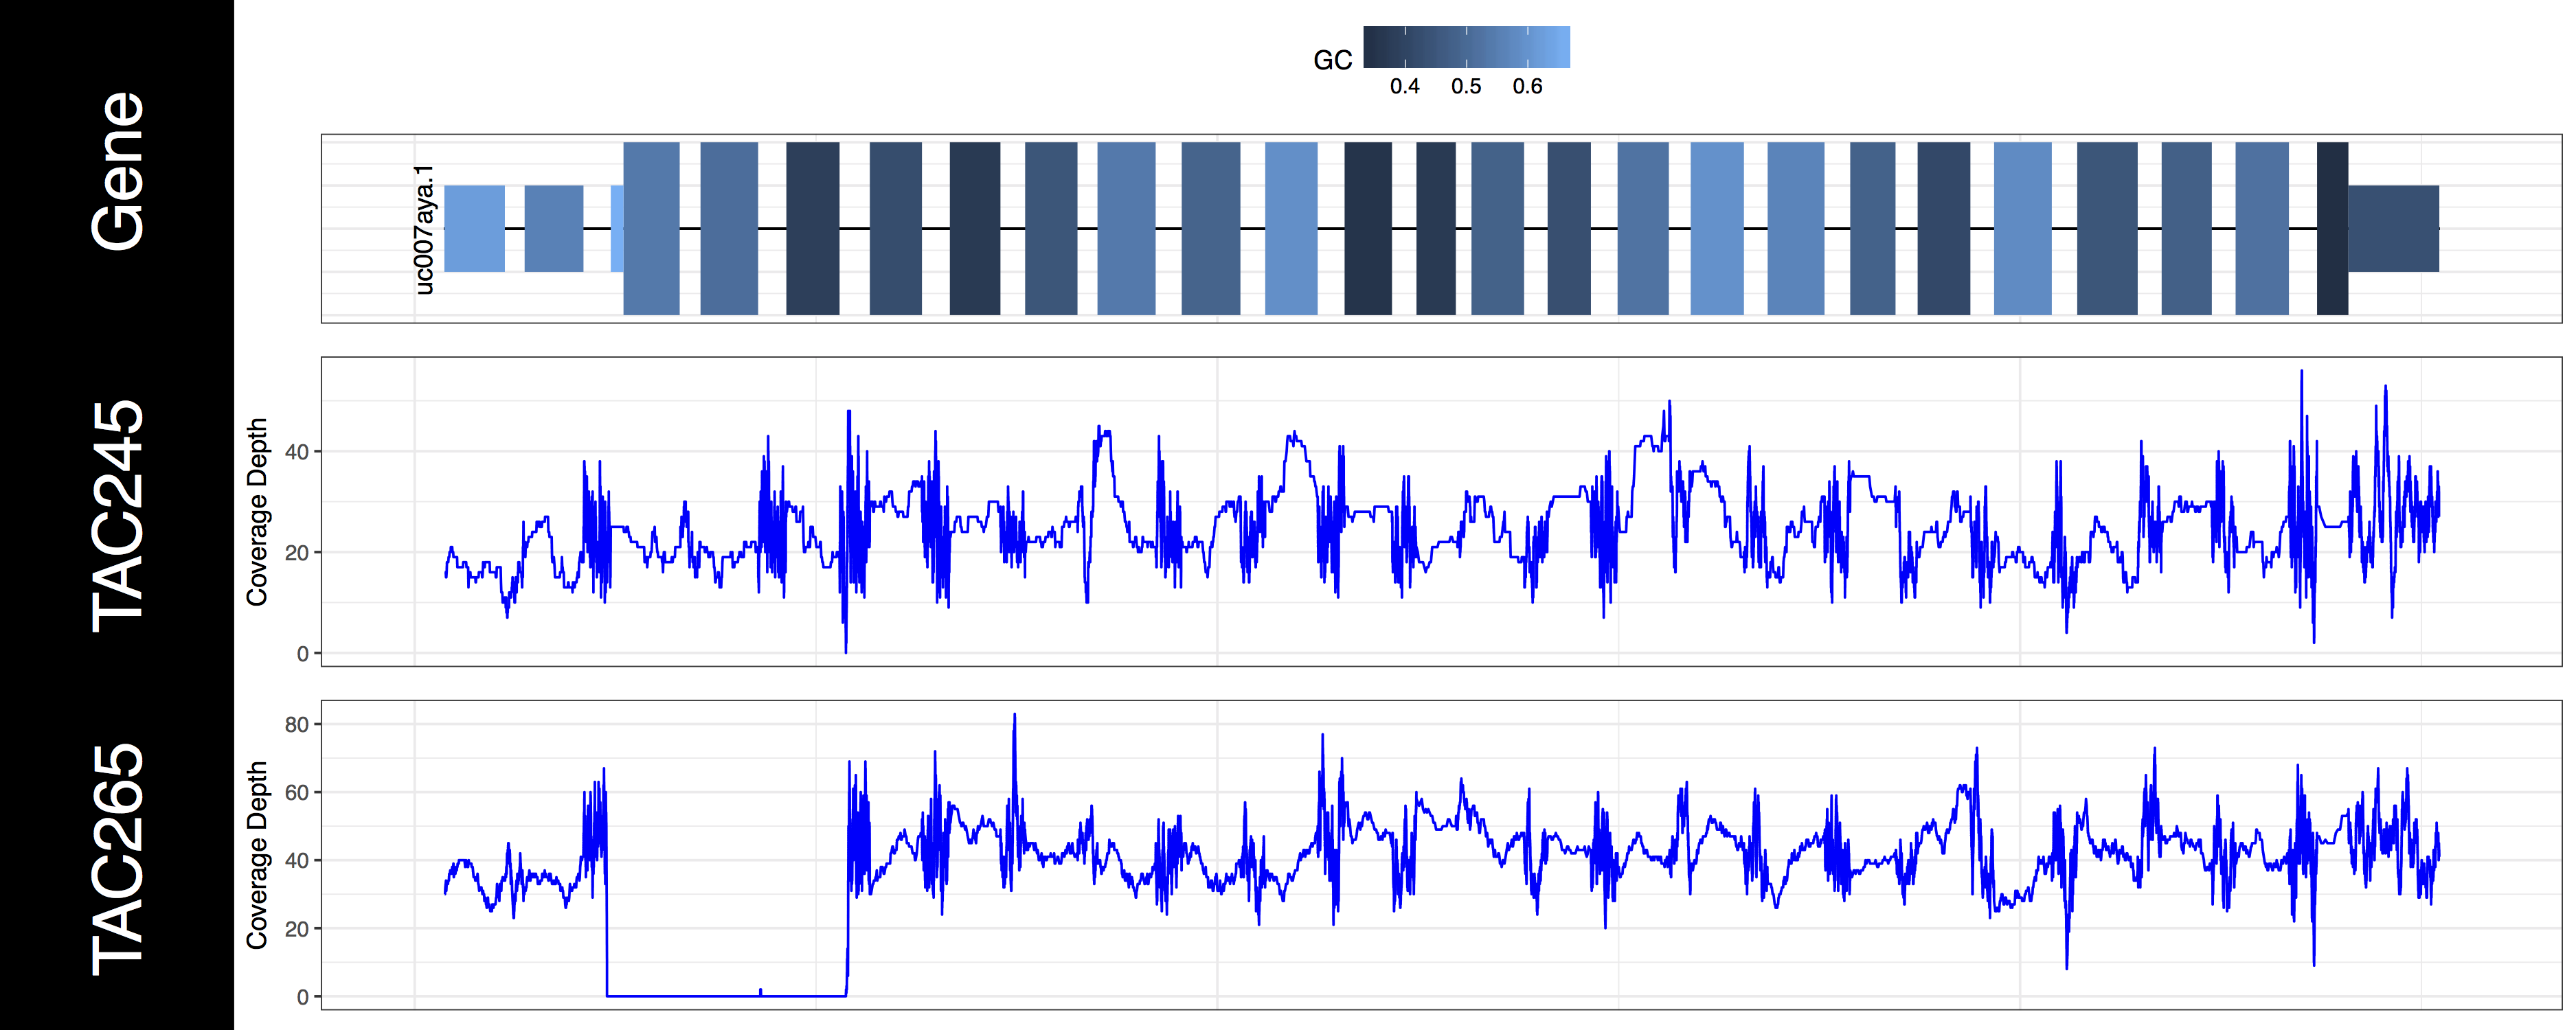
We now have an initial plot, let’s start talking about what is actually being displayed. The first thing you might have noticed is the gene track. Here we have representations for every genomic feature from the TxDb object encompassed by the genomic ranges we specified in grObject. We can see that there are 6 STAT1 isoforms, we can further view the gc content proportion for each feature in this region. You might have noticed a warning message as well, something along the lines of Removed 3 rows containing missing values (geom_text)., and we can see that not all of our isoforms are labled. If you’re wondering what’s going on we specified a genomic range right up to the gene boundaries for a few of these isoforms. Because genCov() is running out of plotting space to place these labels it, or rather ggplot2 removes them. Let’s go ahead and fix that by adding a flank to our genomic range, don’t worry about changing covData, genCov() will compensate and make sure everything still aligns. Let’s also only plot the canonical STAT1 isoform using the gene_isoformSel parameter, looking at the genome browser from UCSC we can see that this is “uc007aya.1”.
# add a flank and create another plot
grObject <- GRanges(seqnames=c("chr1"), ranges=IRanges(start=start-500, end=end+500))
genCov(x=covData, txdb=TxDbObject, gr=grObject, genome=genomeObject, cov_plotType="line", gene_isoformSel="uc007aya.1")
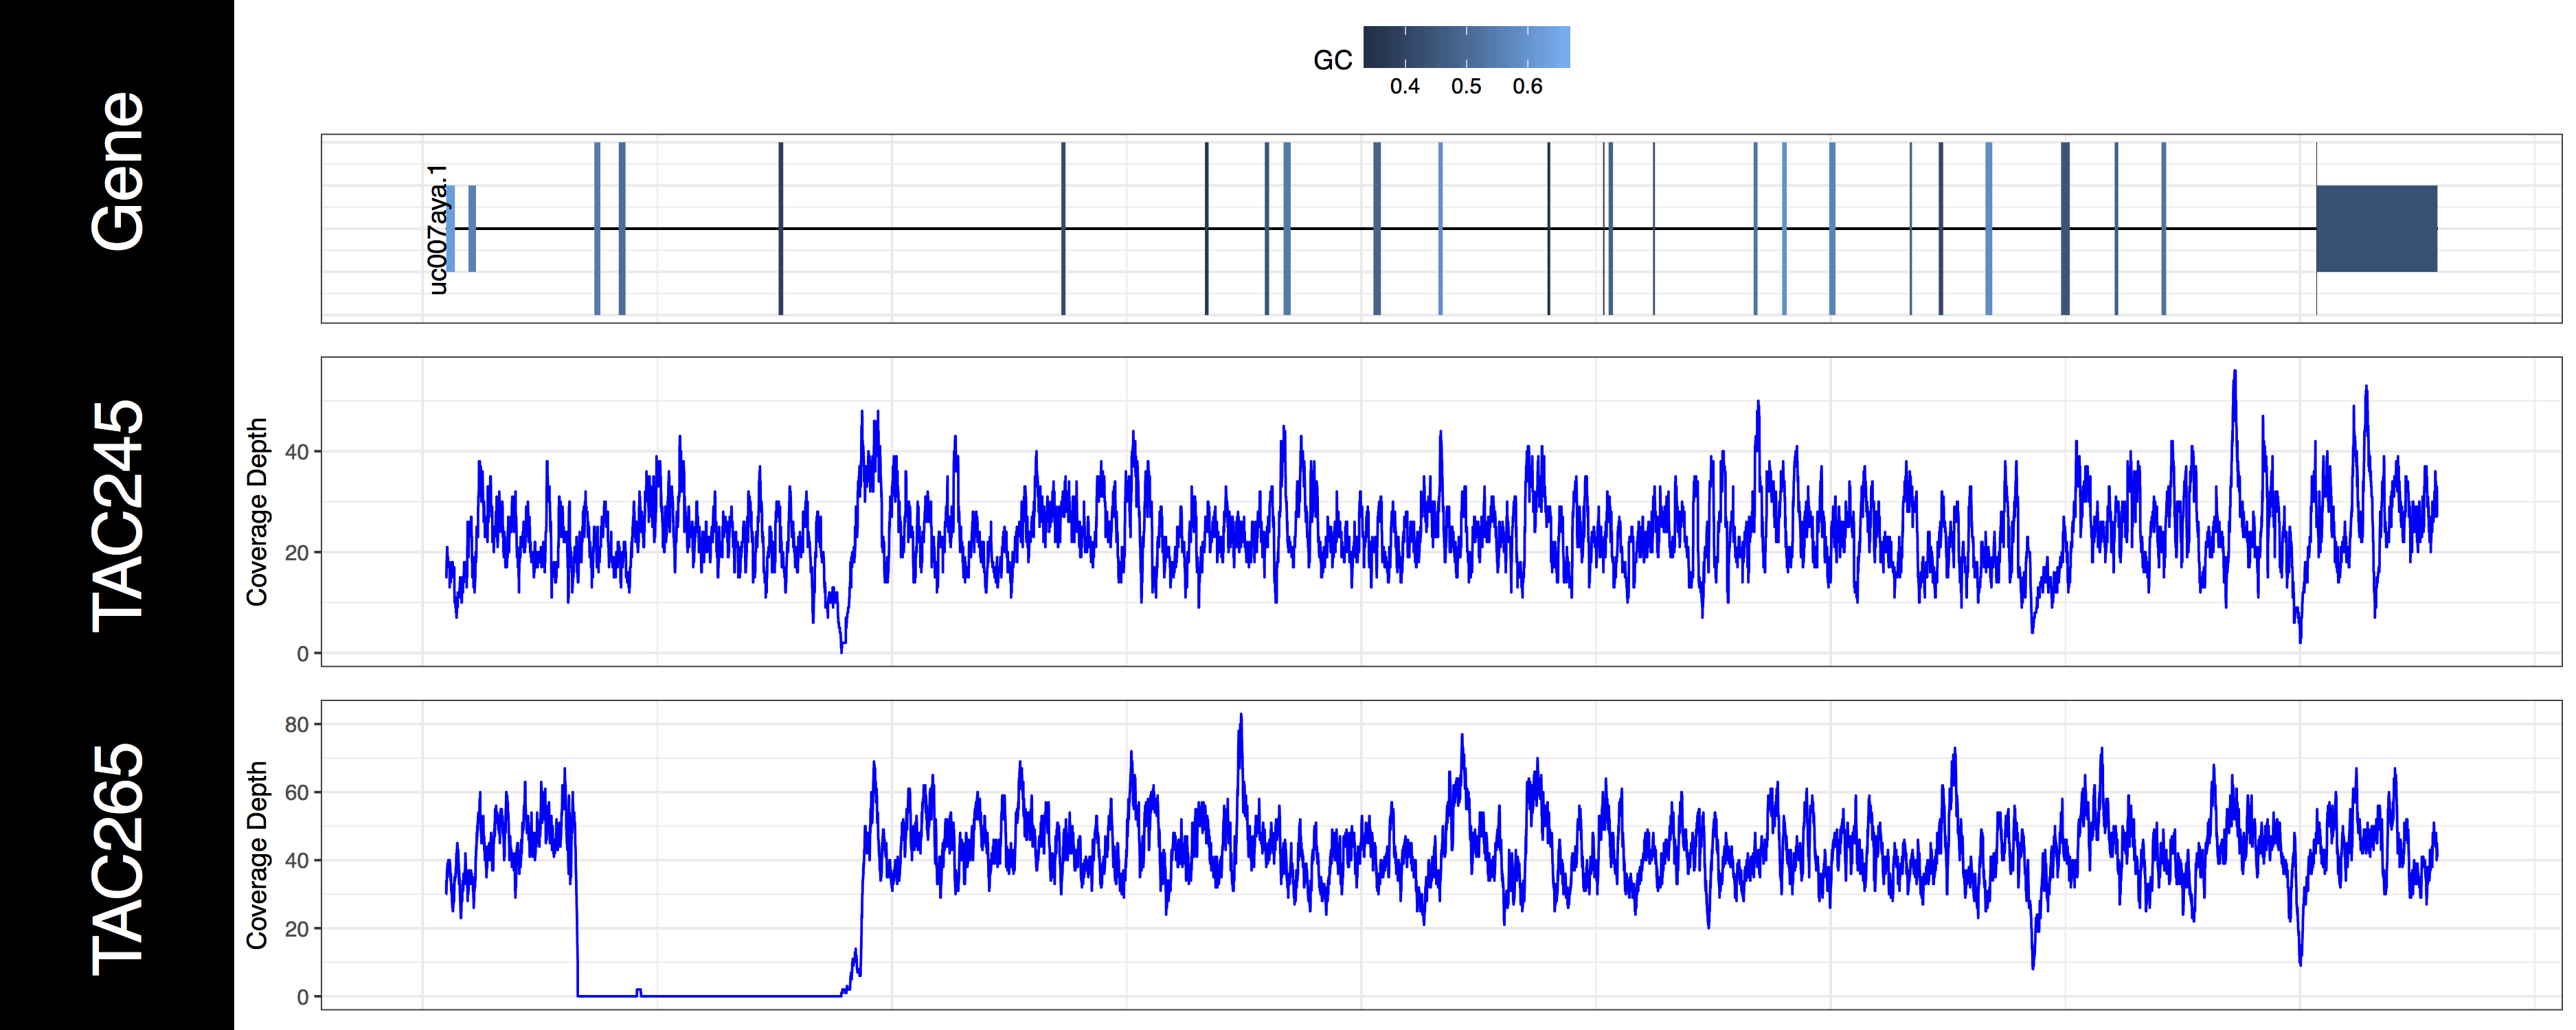
The second thing you may have noticed regarding these plots is that the space between types of genomic features (“cds”, “utr”, “introns”) seems off. In order to plot what is likely the most relevant data genCov() is scaling the space of each of these feature types. By default “Intron”, “CDS”, and “UTR” are scaled by a log factor of 10, 2, and 2 respectively. This can be changed by altering the base and transform parameters which correspond to each other. Alternatively setting these parameters to NA will remove the scaling entirely. Let’s go ahead and do that now just to get a sense of how things look without scaling.
# adjust compression of genomic features
genCov(x=covData, txdb=TxDbObject, gr=grObject, genome=genomeObject, cov_plotType="line", gene_isoformSel="uc007aya.1", base=NA, transform=NA)
Exercises
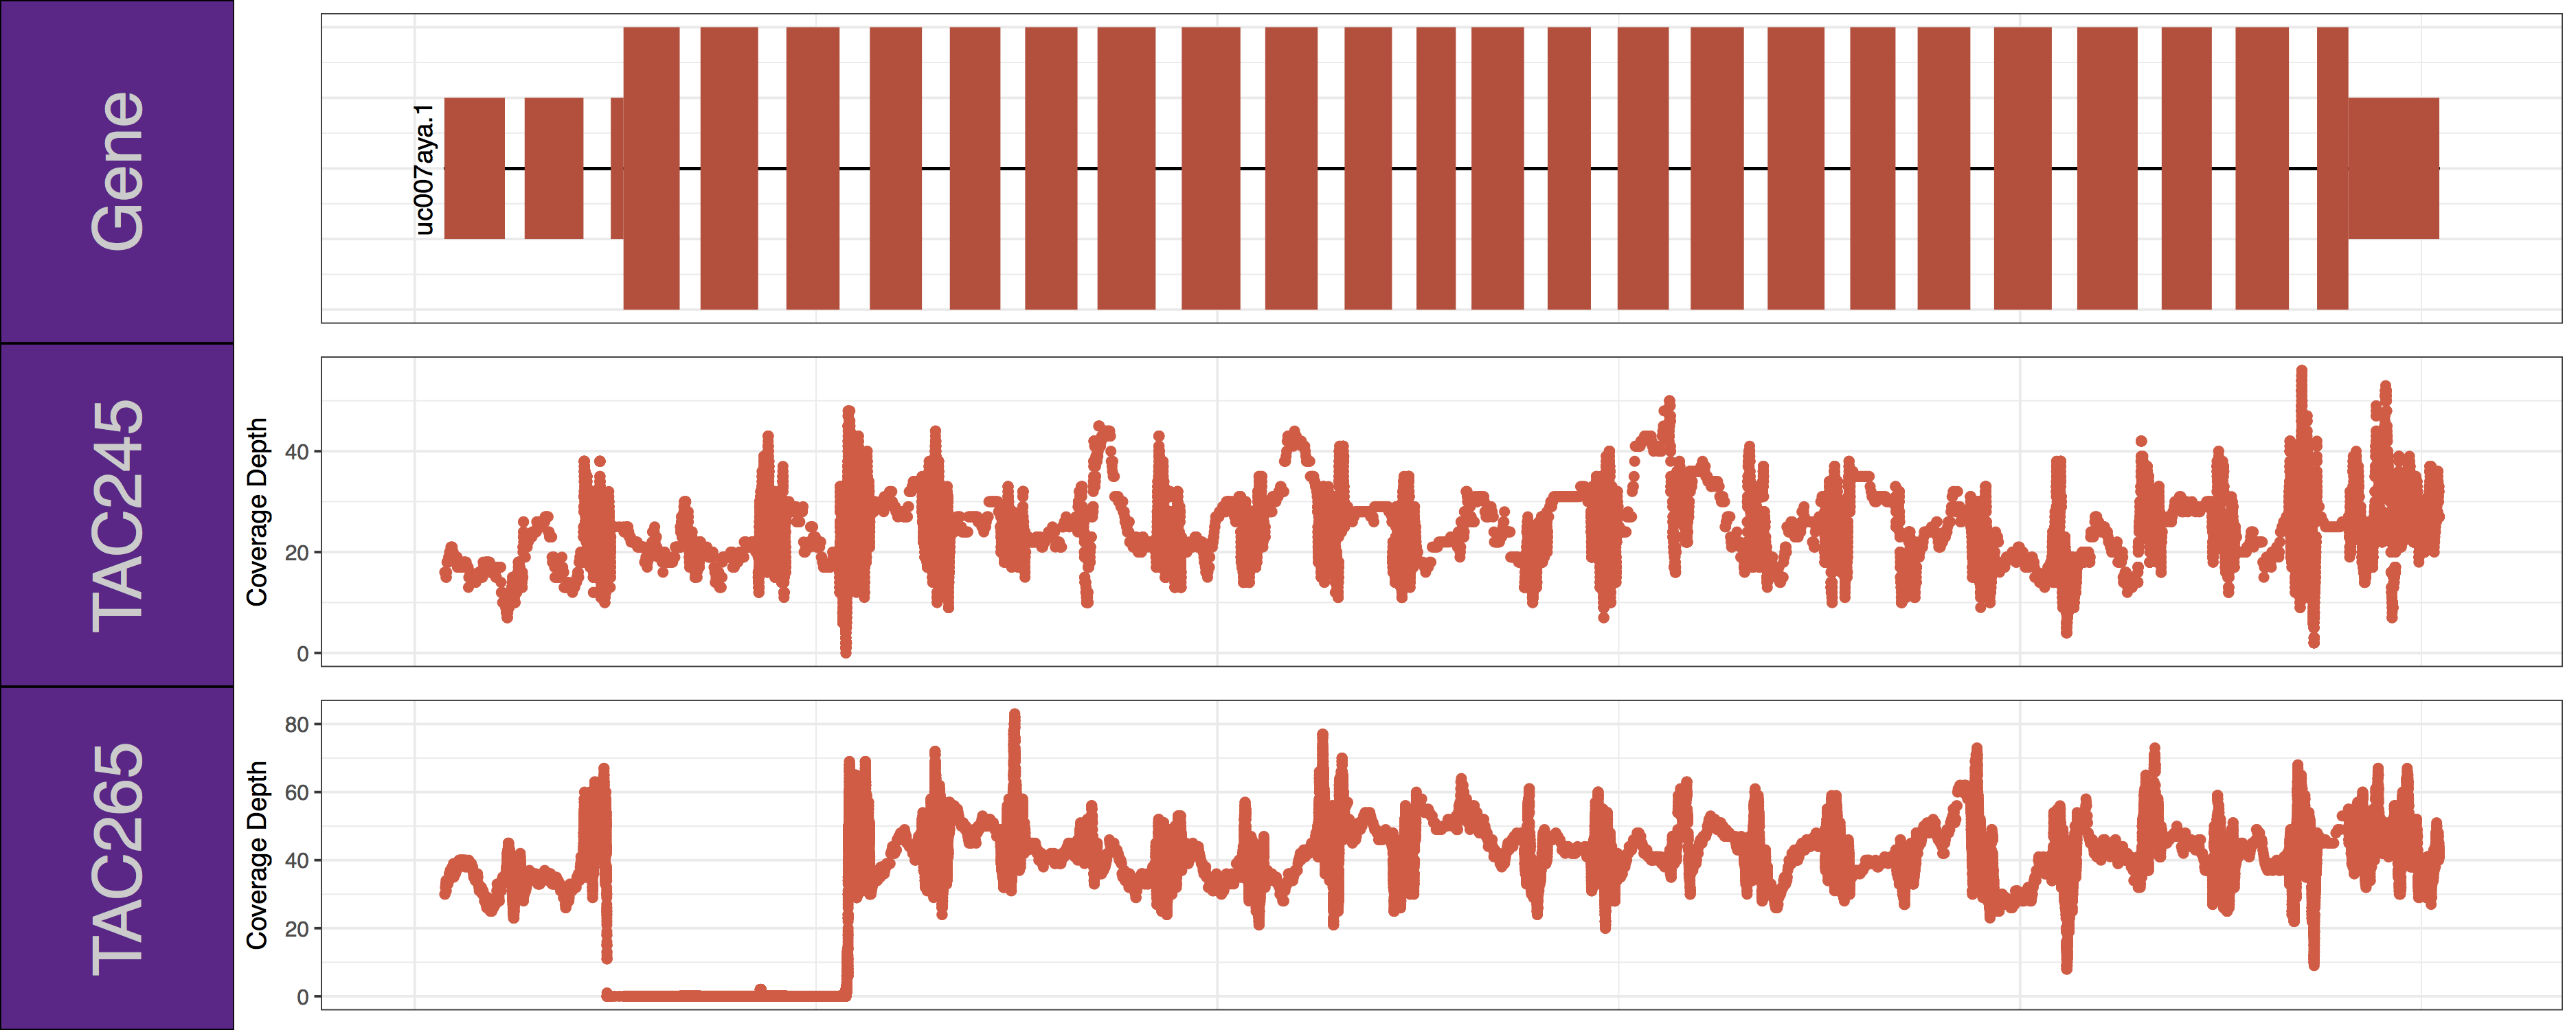
From the plots we produced above we can clearly see the first 3 exons of this isoform have been knocked out successfully in the “TAC265” sample and the “TAC245 Wild Type” sample is unchanged. The genCov() function also has many parameters to customize how the plot looks. Try viewing the documentation for genCov() and use these parameters to produce the plot below, remember documentation can change between version so type ?genCov in your R terminal for documentation specific to the version you have installed.
Get a hint!
Have a look at the following parameters: label_bgFill, label_txtFill, cov_colour, gene_colour
Answer
genCov(x=covData, txdb=TxDbObject, gr=grObject, genome=genomeObject, cov_plotType="point", gene_isoformSel="uc007aya.1", label_bgFill="darkorchid4", label_txtFill="grey80", cov_colour="tomato2", gene_colour="tomato3")