Pathway visualization
A common task after pathway analysis is contructing visualizations to represent experimental data for pathways of interest. There are many tools for this. We will focus on the bioconductor pathview package for this task.
Pathview
Pathview is used to integrate and display data on KEGG pathway maps that it retrieves through API queries to the KEGG database. Please refer to the pathview vignette and KEGG website for license information as there may be restrictions for commercial use due for these API queries. Pathview itself is open source and is able to map a wide variety of biological data relevant to pathway views. In this section we will be mapping the overall expression results for a few pathways from the pathway analysis section of this course. Let’s start by installing pathview from bioconductor and loading the data we created in the previous section.
# Install pathview from bioconductor
source("https://bioconductor.org/biocLite.R")
biocLite("pathview")
library(pathview)

load(url("http://genomedata.org/gen-viz-workshop/pathway_visualization/pathview_Data.RData"))
Visualizing KEGG pathways
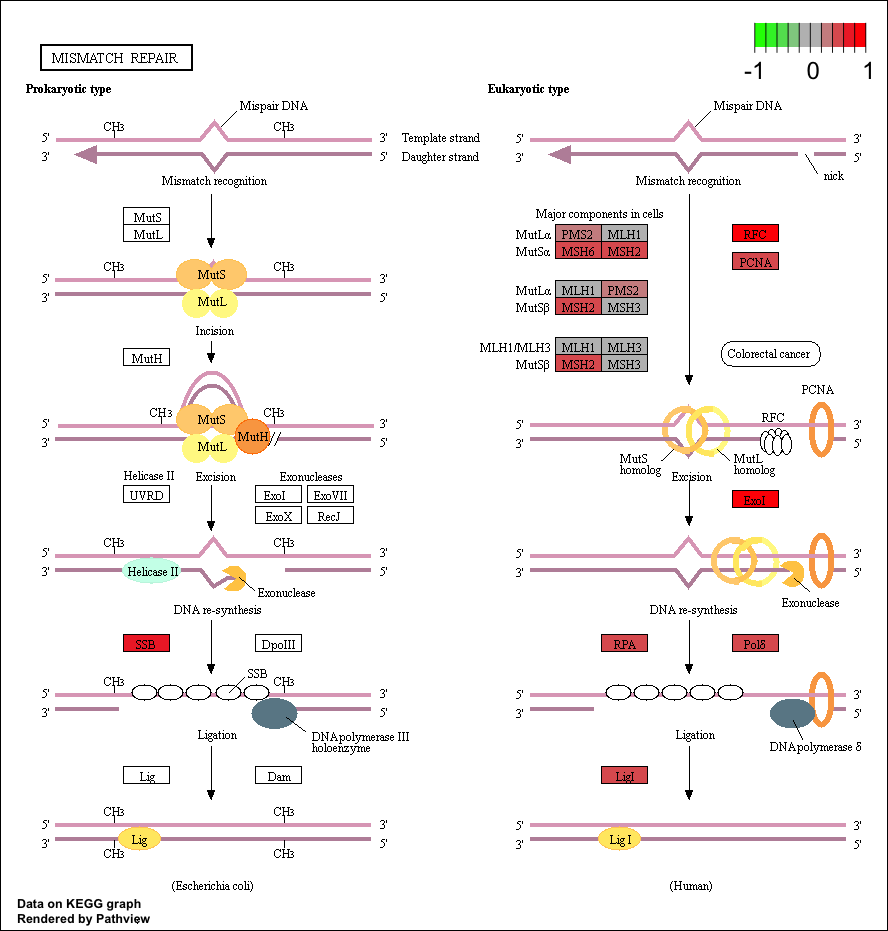
Now that we have our initial data loaded let’s choose a few pathways to visualize. The “Mismatch repair” repair pathway is significantly perturbed by up regulated genes, and corresponds to the following kegg id: “hsa03430”. We can view this using the row names of the pathway dataset fc.kegg.sigmet.p.up. Let’s use our experiment’s expression in the data frame tumor_v_normal_DE.fc and view it in the context of this pathway. Two graphs will be written to your current working directory by the pathview() function, one will be the original kegg pathway view and the second one will have expression values overlayed (see below). You can find your current working directory with the function getwd().
# View the hsa03430 pathway from the pathway analysis
fc.kegg.sigmet.p.up[grepl("hsa03430", rownames(fc.kegg.sigmet.p.up), fixed=TRUE),]

# Overlay the expression data onto this pathway
pathview(gene.data=tumor_v_normal_DE.fc, species="hsa", pathway.id="hsa03430")

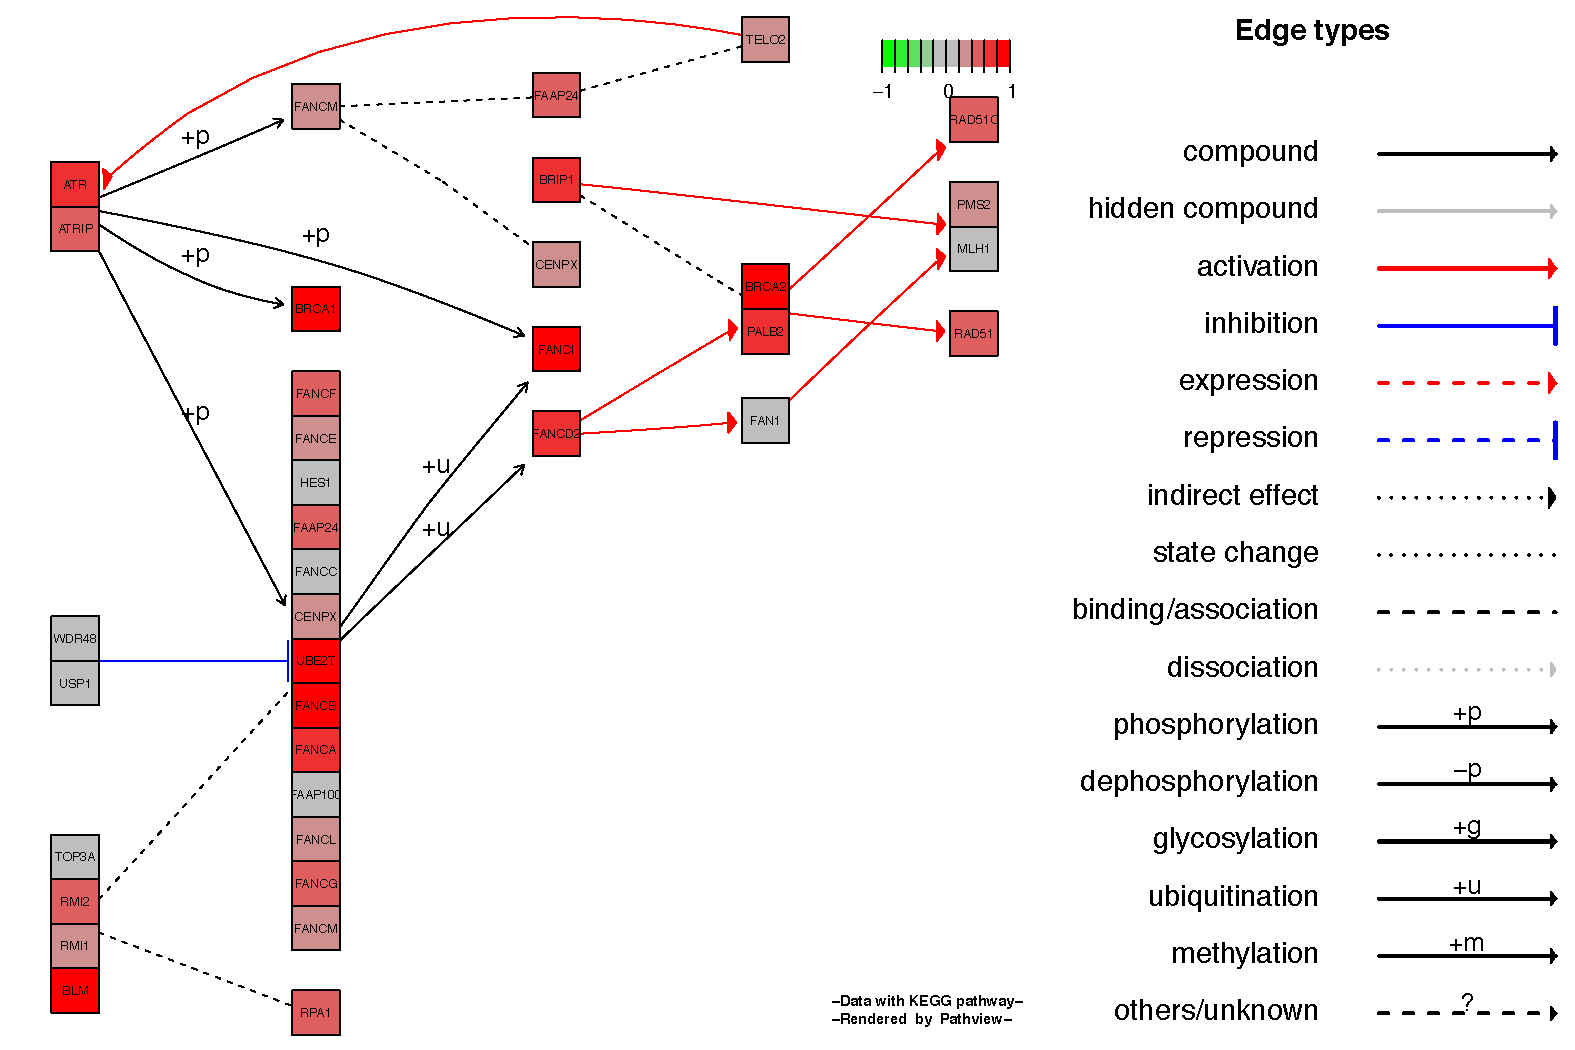
It is often nice to see the relationship between genes in the kegg pathview diagrams, this can be achieved by setting the parameter kegg.native=FALSE. Below we show an example for the Fanconi anemia pathway.
# View the hsa03430 pathway from the pathway analysis
fc.kegg.sigmet.p.up[grepl("hsa03460", rownames(fc.kegg.sigmet.p.up), fixed=TRUE),]

# Overlay the expression data onto this pathway
pathview(gene.data=tumor_v_normal_DE.fc, species="hsa", pathway.id="hsa03460", kegg.native=FALSE)

