Genome Browsing and Visualization - UCSC
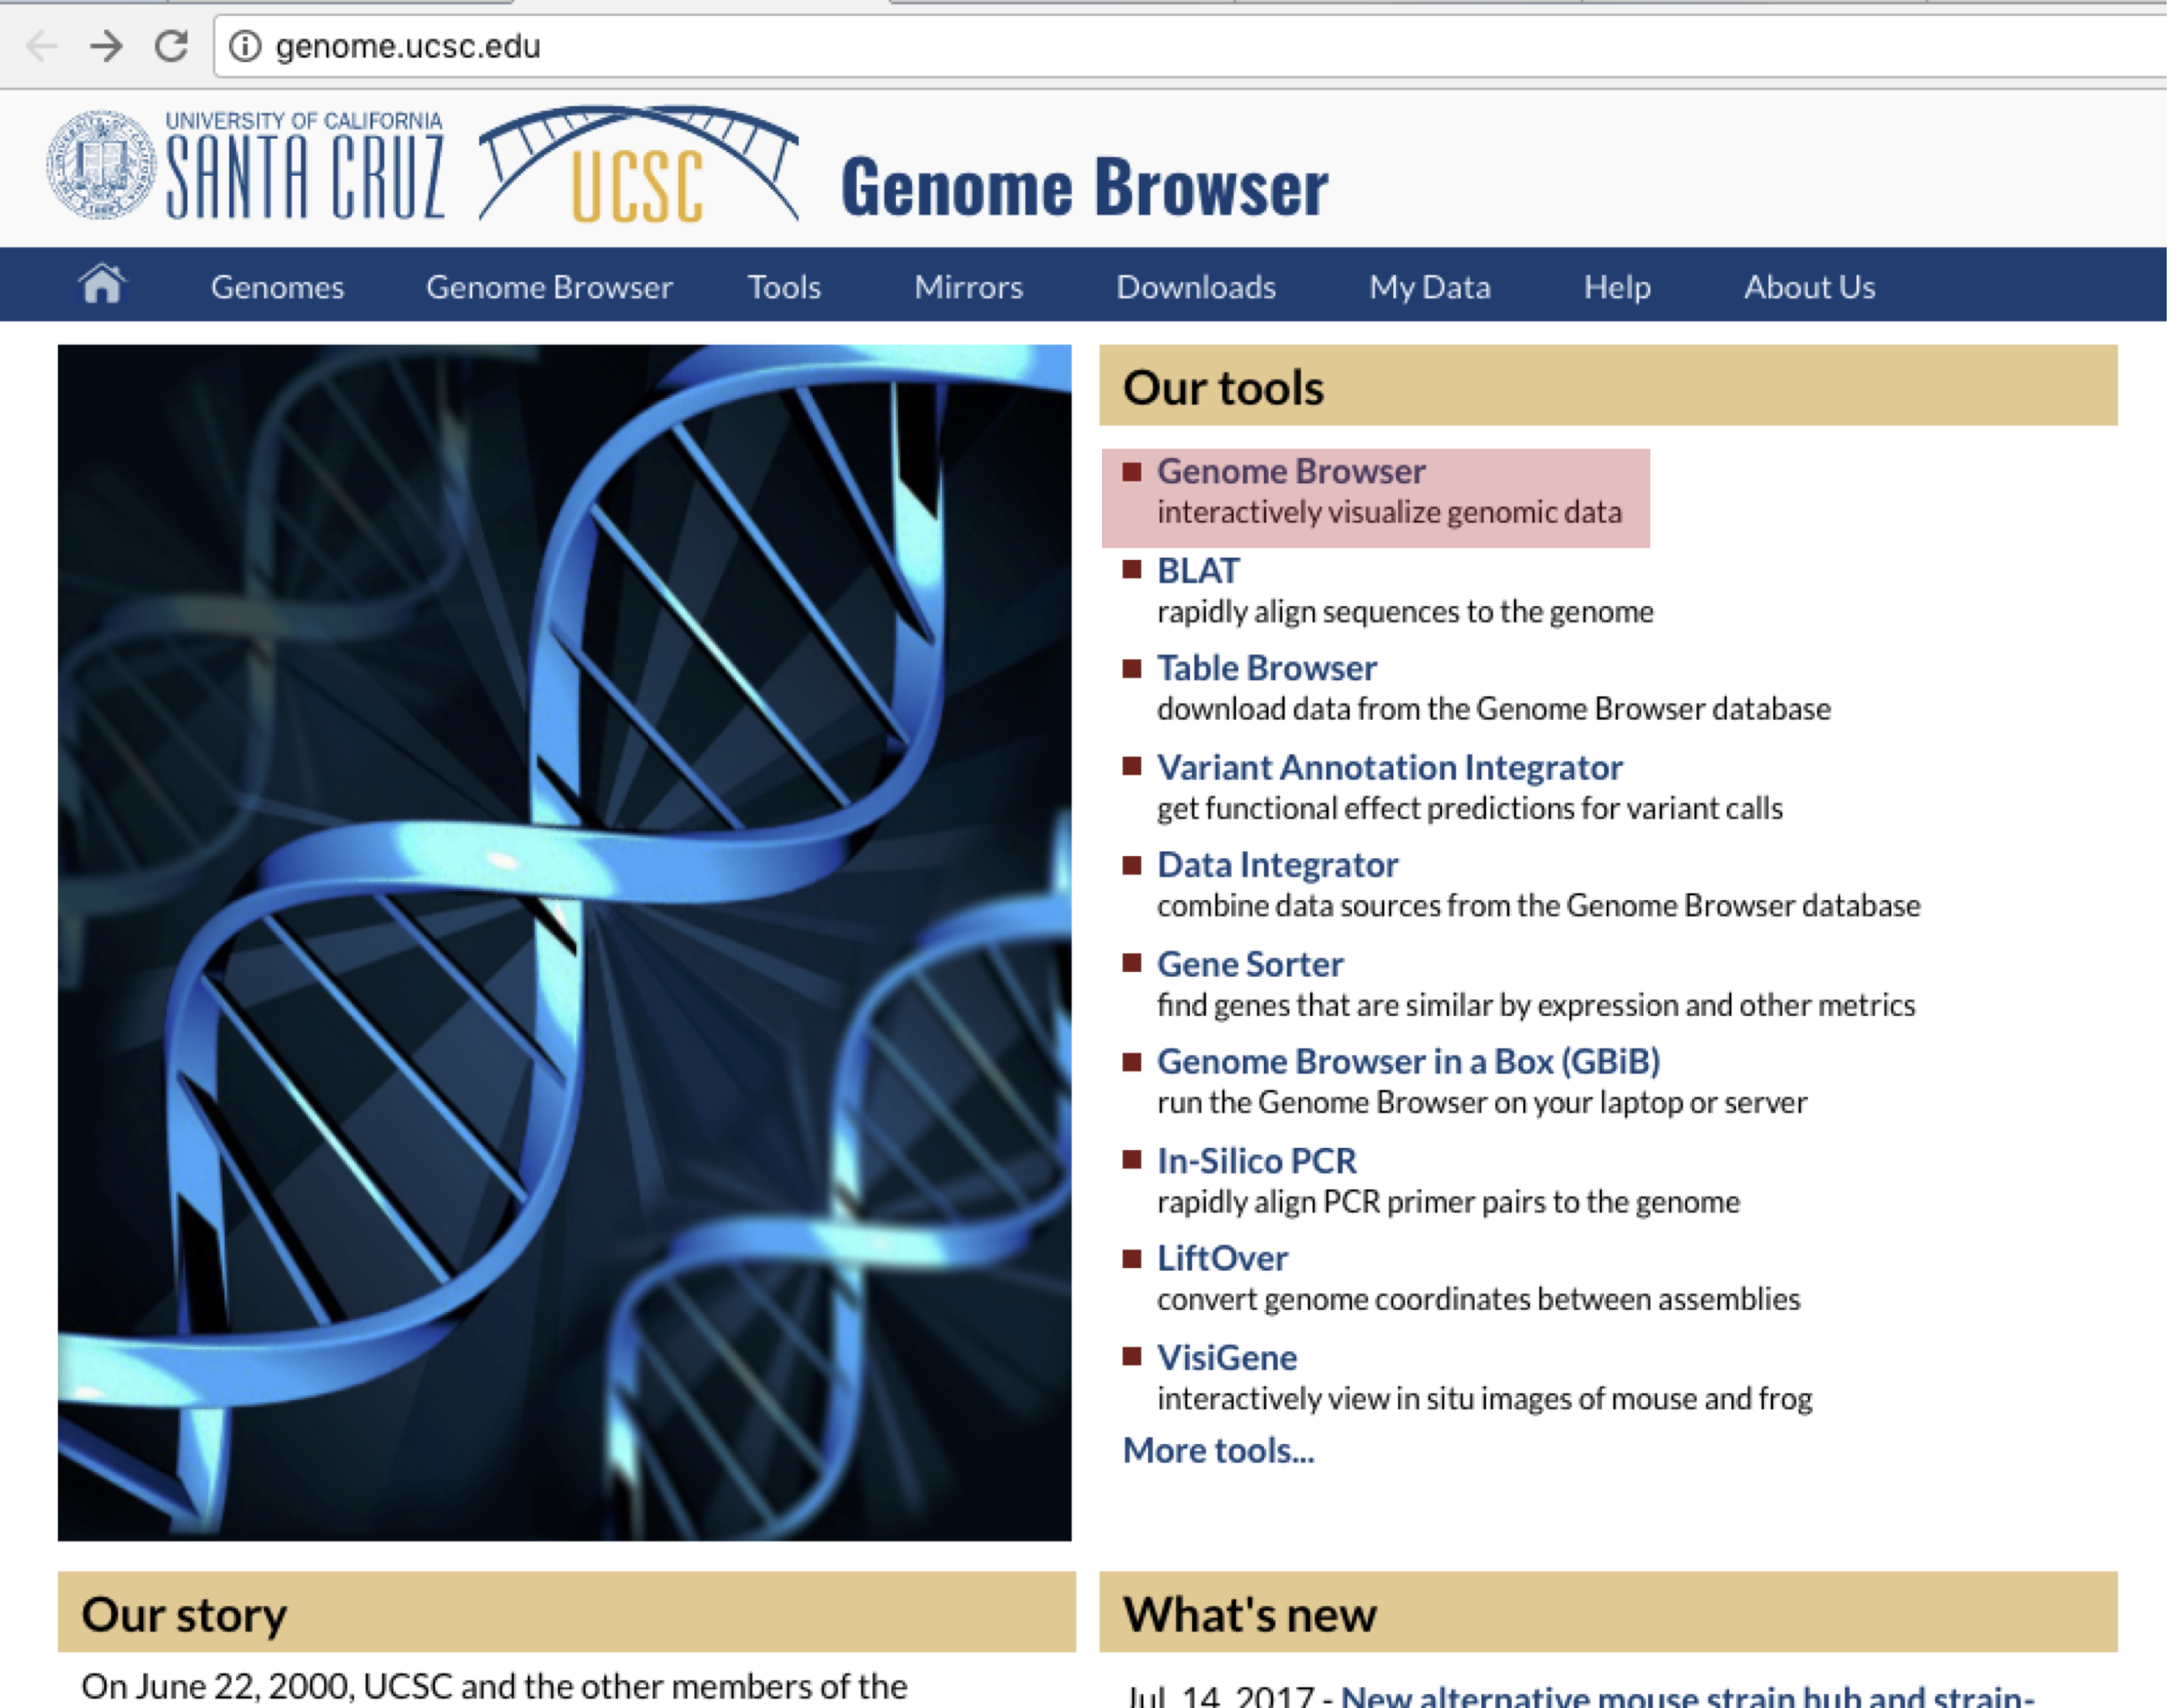
The UCSC genome browser is a powerful web application for exploring the genomes of a variety of organisms in the context of a rich set of annotation tracks. Let’s start by navigating to the UCSC genome browser homepage at http://genome.ucsc.edu and clicking on Genome Browser. Over the course of this tutorial we will be highlighting features with transparent (pink or green) textbox, please pay attention to these as they are relevant to the discussion.
Selecting an organism and assembly
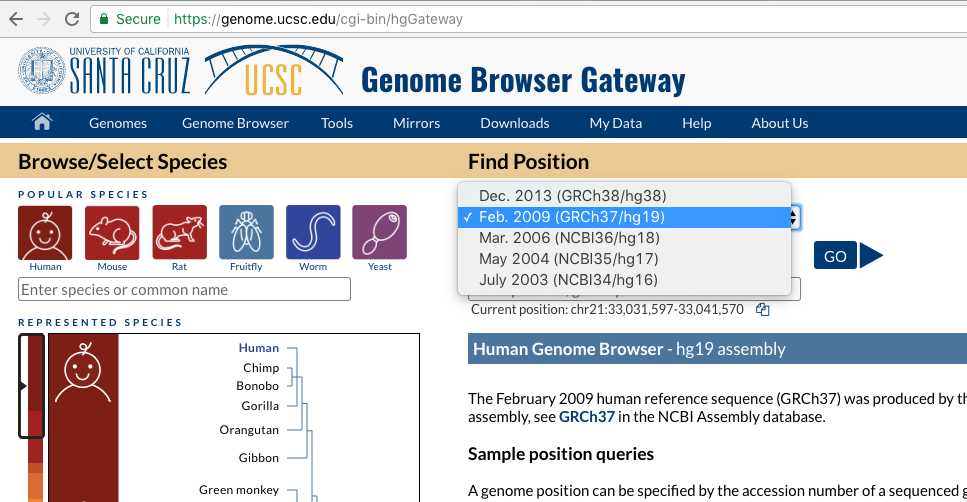
This will take us to the browser gateway where we can select the organism we wish to view as well as the assembly for that organism. For this tutorial we will be using the Febuary 2009 assembly of the human genome (GRCh37/hg19), let’s go ahead and select that from the Human Assembly dropdown menu and click on “GO”.
Navigating around the genome
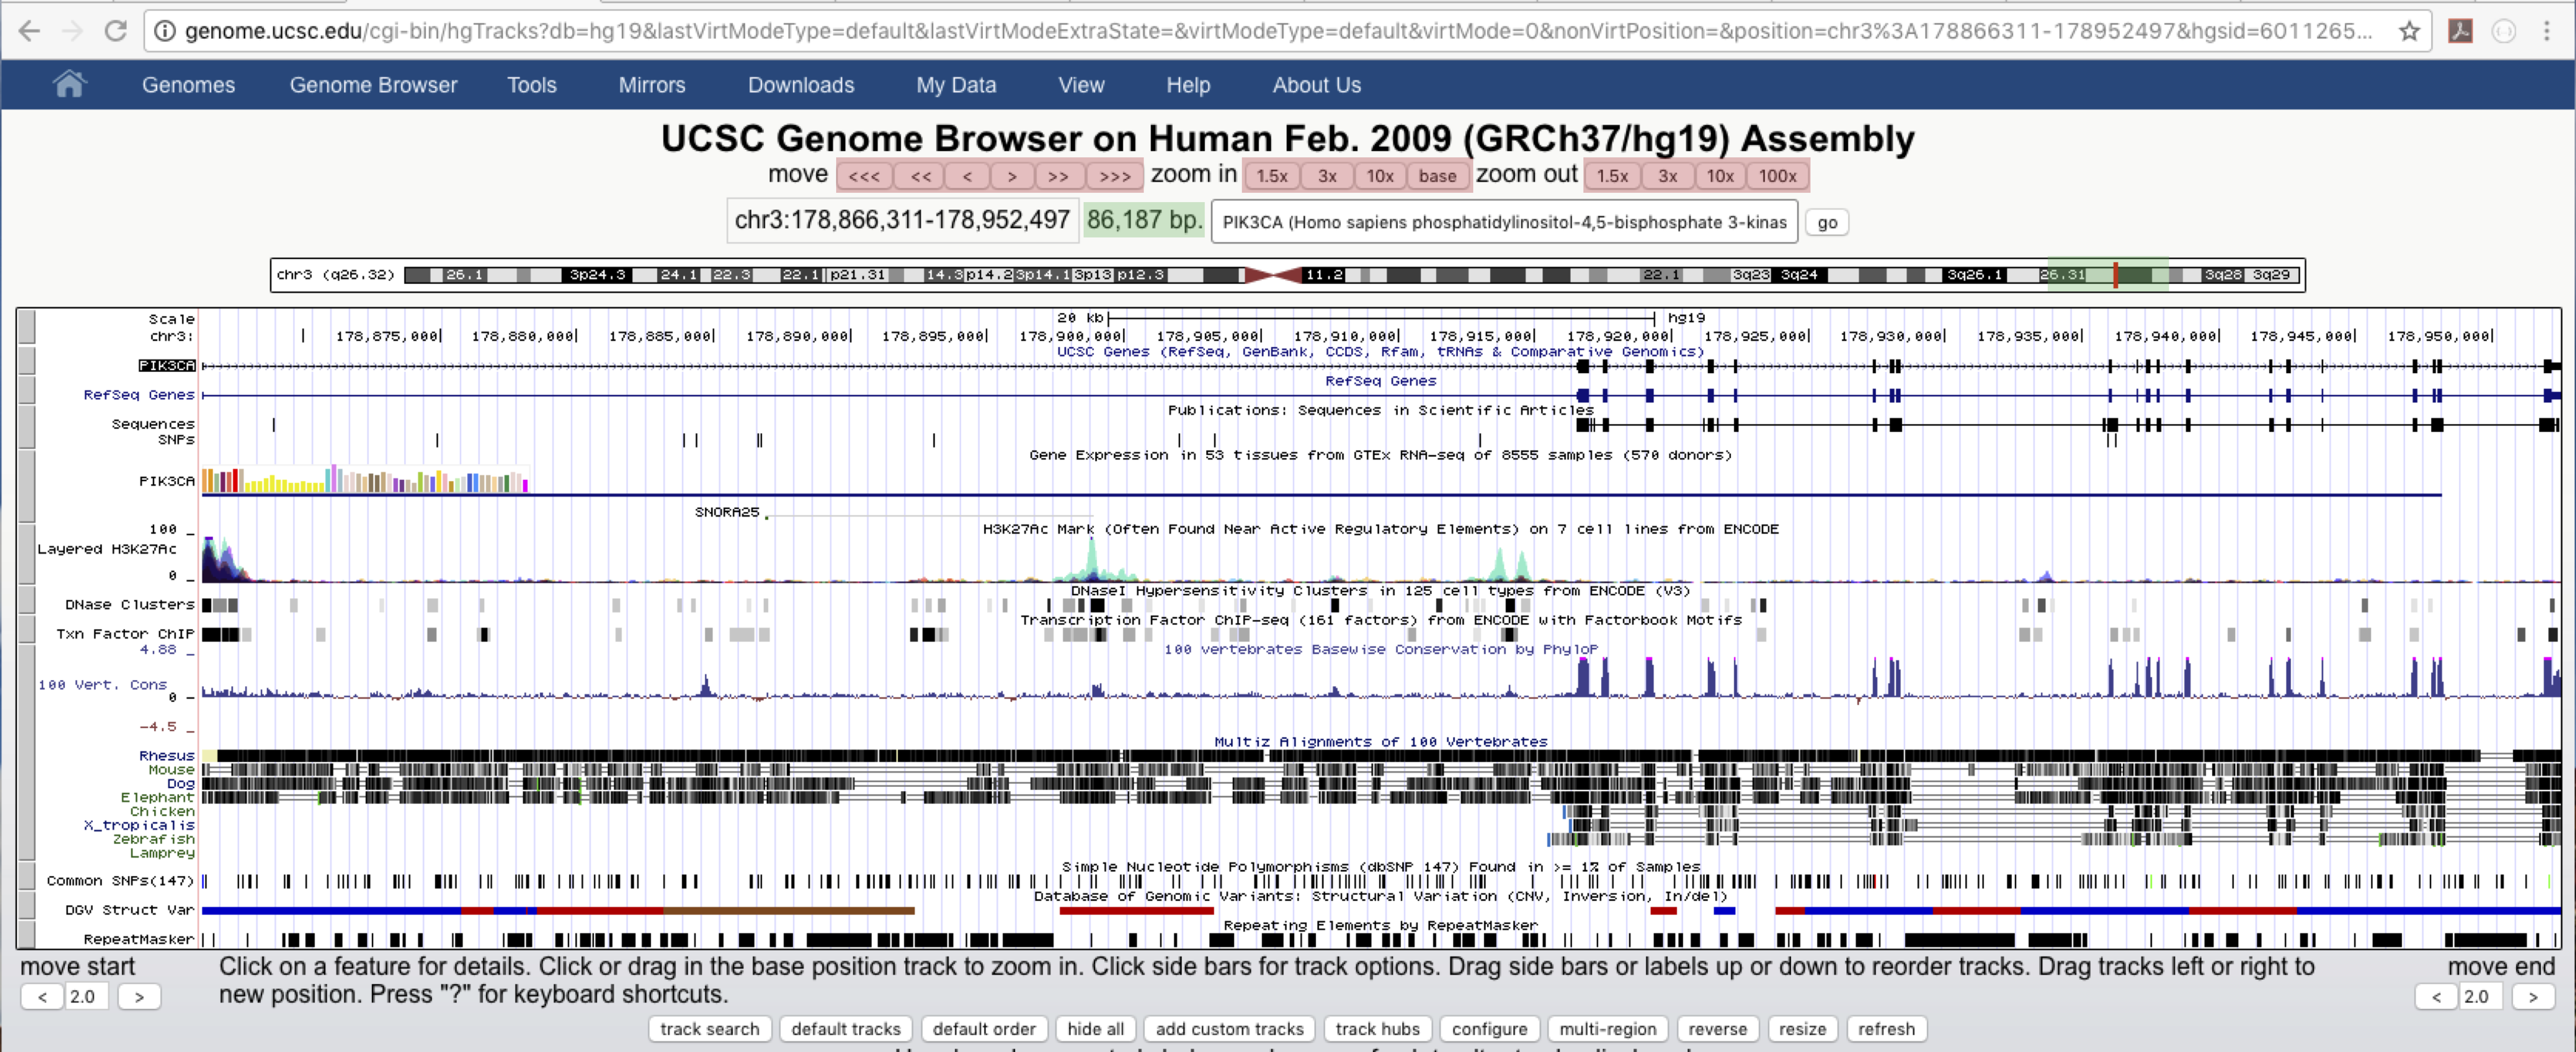
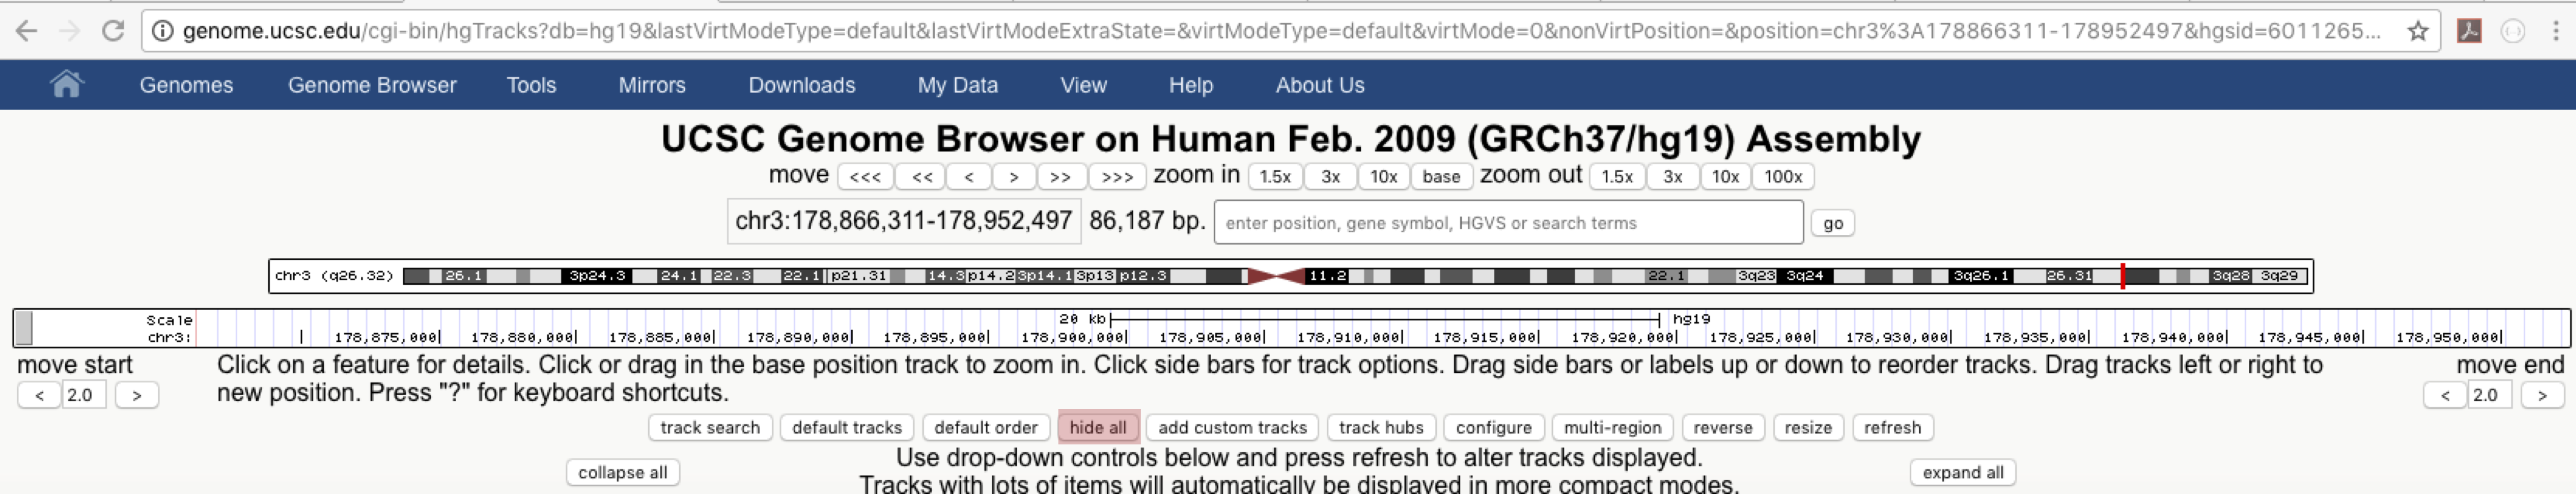
We are now in the genome browser for our chosen reference assembly. There is a lot of information here, but let’s start with the basics, navigating around. We can jump to a position or gene by entering them in the highlighted text box below, let’s jump to PIK3CA which has coordinates chr3:178,866,311-178,952,497. After jumping to PIK3CA we can see in the image below that PIK3CA is 86,187 base pairs long and resides on the q arm of chromosome 3 (green text boxes). We can shift our viewing window with the arrow keys on the top left and we can zoom in and out using the zoom buttions on the right (red text boxes). In addition clicking and dragging inside the coordinate track within the browser will zoom to the window highlighted by such an action. Performing this action within any of the other tracks will shift the viewing window left or right. These are analogous to using the buttons mentioned above but allow for more user control.
Genome browser tracks
One of the features that makes the genome browser so useful are the tracks displayed in the context of the genome assembly. Users can add and remove tracks by using the buttons below the genome browser. Clicking on the name of a track will allow for more fine grain control of that track and give additional information regarding that track such as source, citation and version numbers. A number of tracks are turned on by default, but let’s go ahead and hide all tracks to get a better sense of what’s going on, click on the “hide all” button below the genome browser.
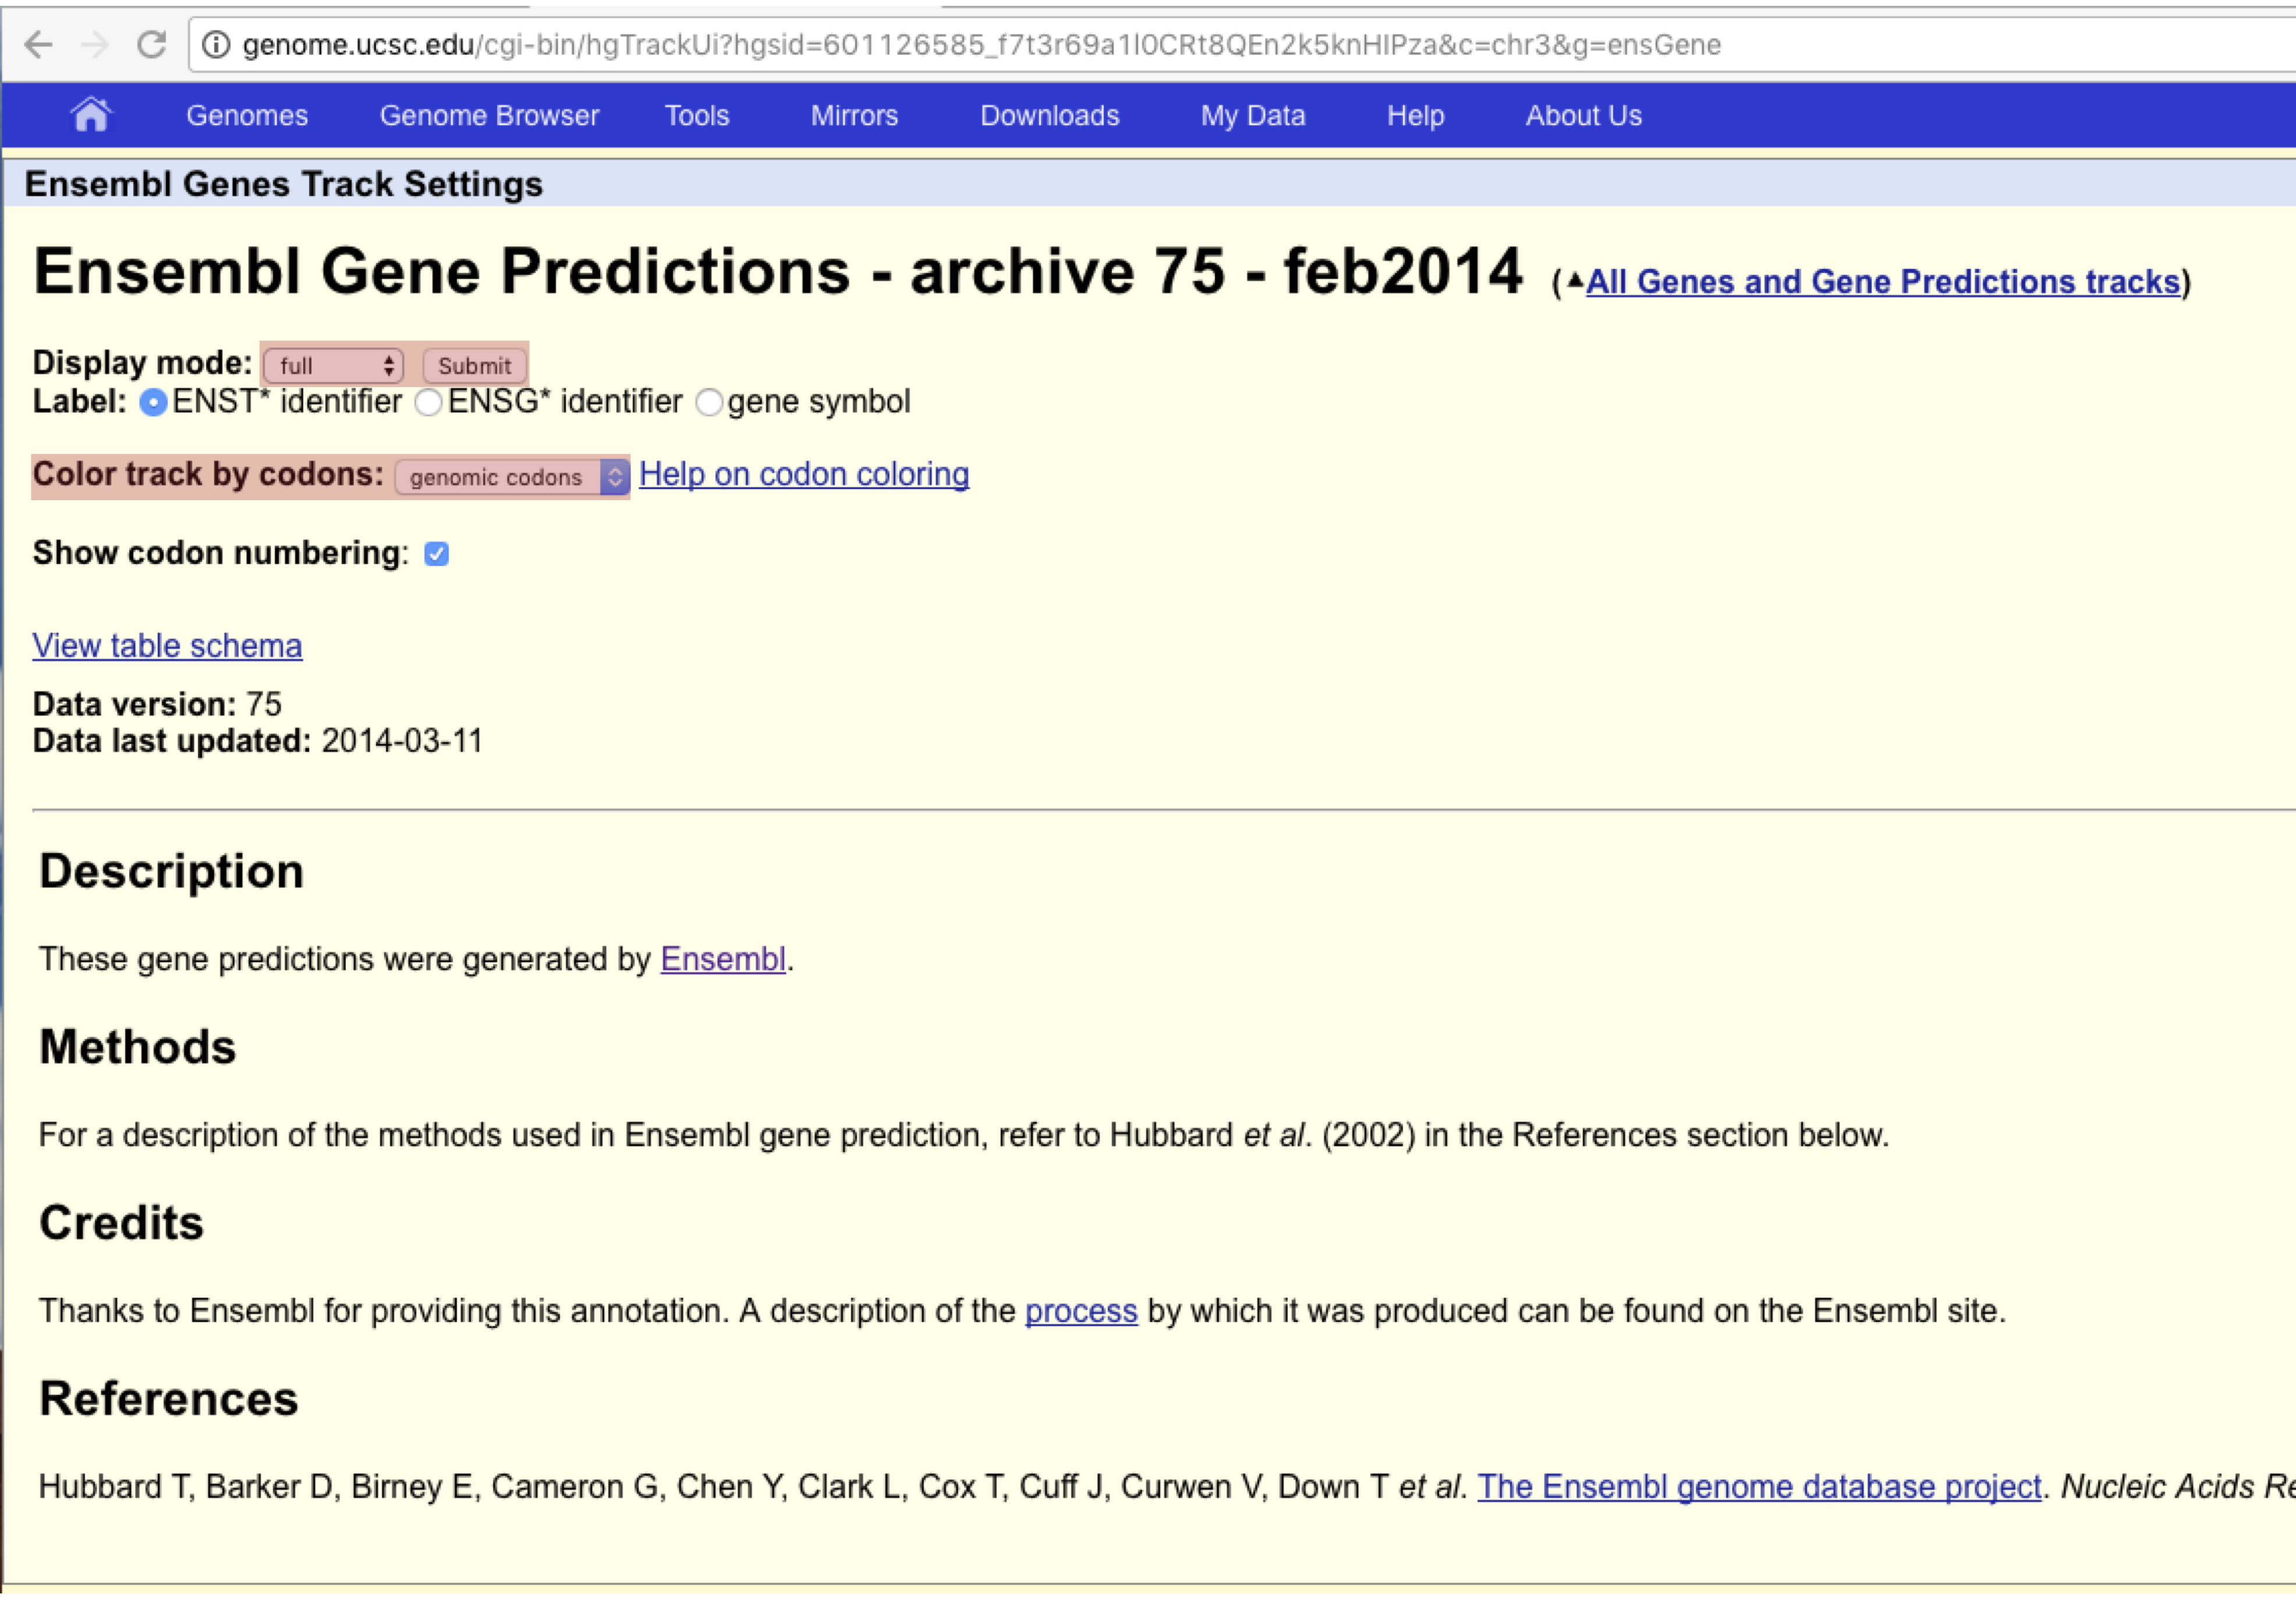
The browser should now be empty of tracks, let’s go ahead and add the ensembl gene track, find Ensembl Genes under “Genes and Gene Predictions” and click on the link. You should see a page similar to the one below. Go ahead and set the Display mode to “full”, turn on “Color track by codons” and then hit “Submit”. This will turn on Ensembl gene annotations using Ensembl version 75.
As is exhibited below we can now see the full list of ensembl transcipts of PIK3CA based on the ensembl version 75 annotations of which there are 5. You can add as many tracks onto the viewer as you want but note that the available tracks will differ between species and even between assemblies.
Turn on the GTEx Gene track. Which tissue/cell type has the highest expression of PIK3CA?
Get a hint!
Try clicking on the track in the genome browser once it's enabled
Answer
Cells - EBV-transformed lymphocytes have the highest average expression at 11.3 RPKM.
BLAST-like alignment tool
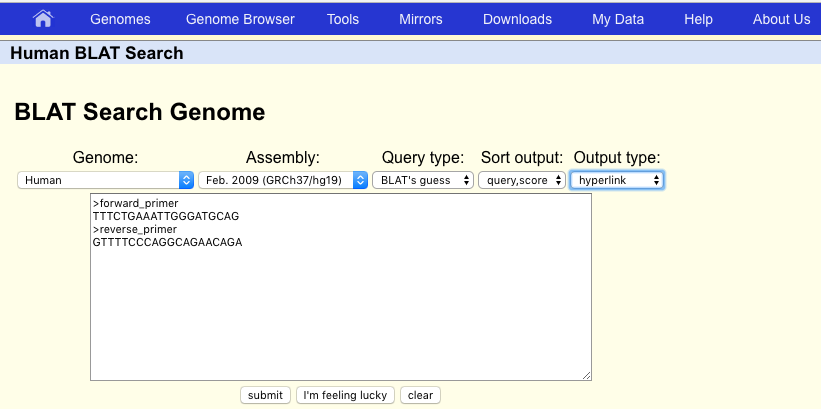
Our discussion of the genome browser would not be complete without mentioning the BLAST-like alignment tool commonly refered to as BLAT. As the name would suggest BLAT works similarly to BLAST, however it works in conjunction with the UCSC genome browser and aligns only to the specified genome assembly. Let’s use BLAT to look at which section of the hg19 genome assembly the first primer pair in Supplemental Table S2 is amplifying, from the paper: “Non-exomic and synonymous variants in ABCA4 are an important cause of Stargardt disease.”. The forward primer used in this experiment is TTTCTGAAATTGGGATGCAG and the reverse primer is GTTTTCCCAGGCAGAACAGA. Go ahead and input these primers into BLAT in fasta format. Make sure to select the human hg19 reference assembly, then go ahead and click on submit.
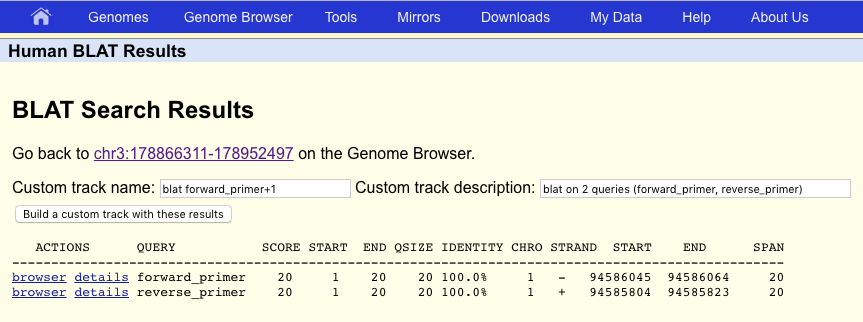
BLAT will search the genome and output a table of possible matches between the genome assembly and the primer sequences. Unsurprisingly there are only two entries, one for each primer and each with 100% identity. Go ahead and click on “browser” to view one of these on the UCSC genome browser. The second primer should be close by, try and zoom out to find it.
Which gene do these primers attempt to amplify?
Answer
ABCA4
UCSC Table Browser
BLAT allowed us to get to a region based on a sequence, but what if we want to do the reverse of that, to get a sequence based on a region. Fortunately the UCSC genome browser has a tool for that as well called the UCSC Table Browser. Let’s get the DNA sequence for the gene PRLR using this tool. First navigate to the UCSC Table Browser (under Tools). There are a lot of options here but we only need to concern ourselves with a few. First make sure that the proper assembly is specified, in our case this should be hg19 (red boxes). Next because we want to return the sequence of the PRLR gene “Genes and Gene Predictions” should be selected under group. Let’s go ahead and look for this gene in the “UCSC Genes” track (green boxes). Further the table should be set to “knownGene” (blue box).
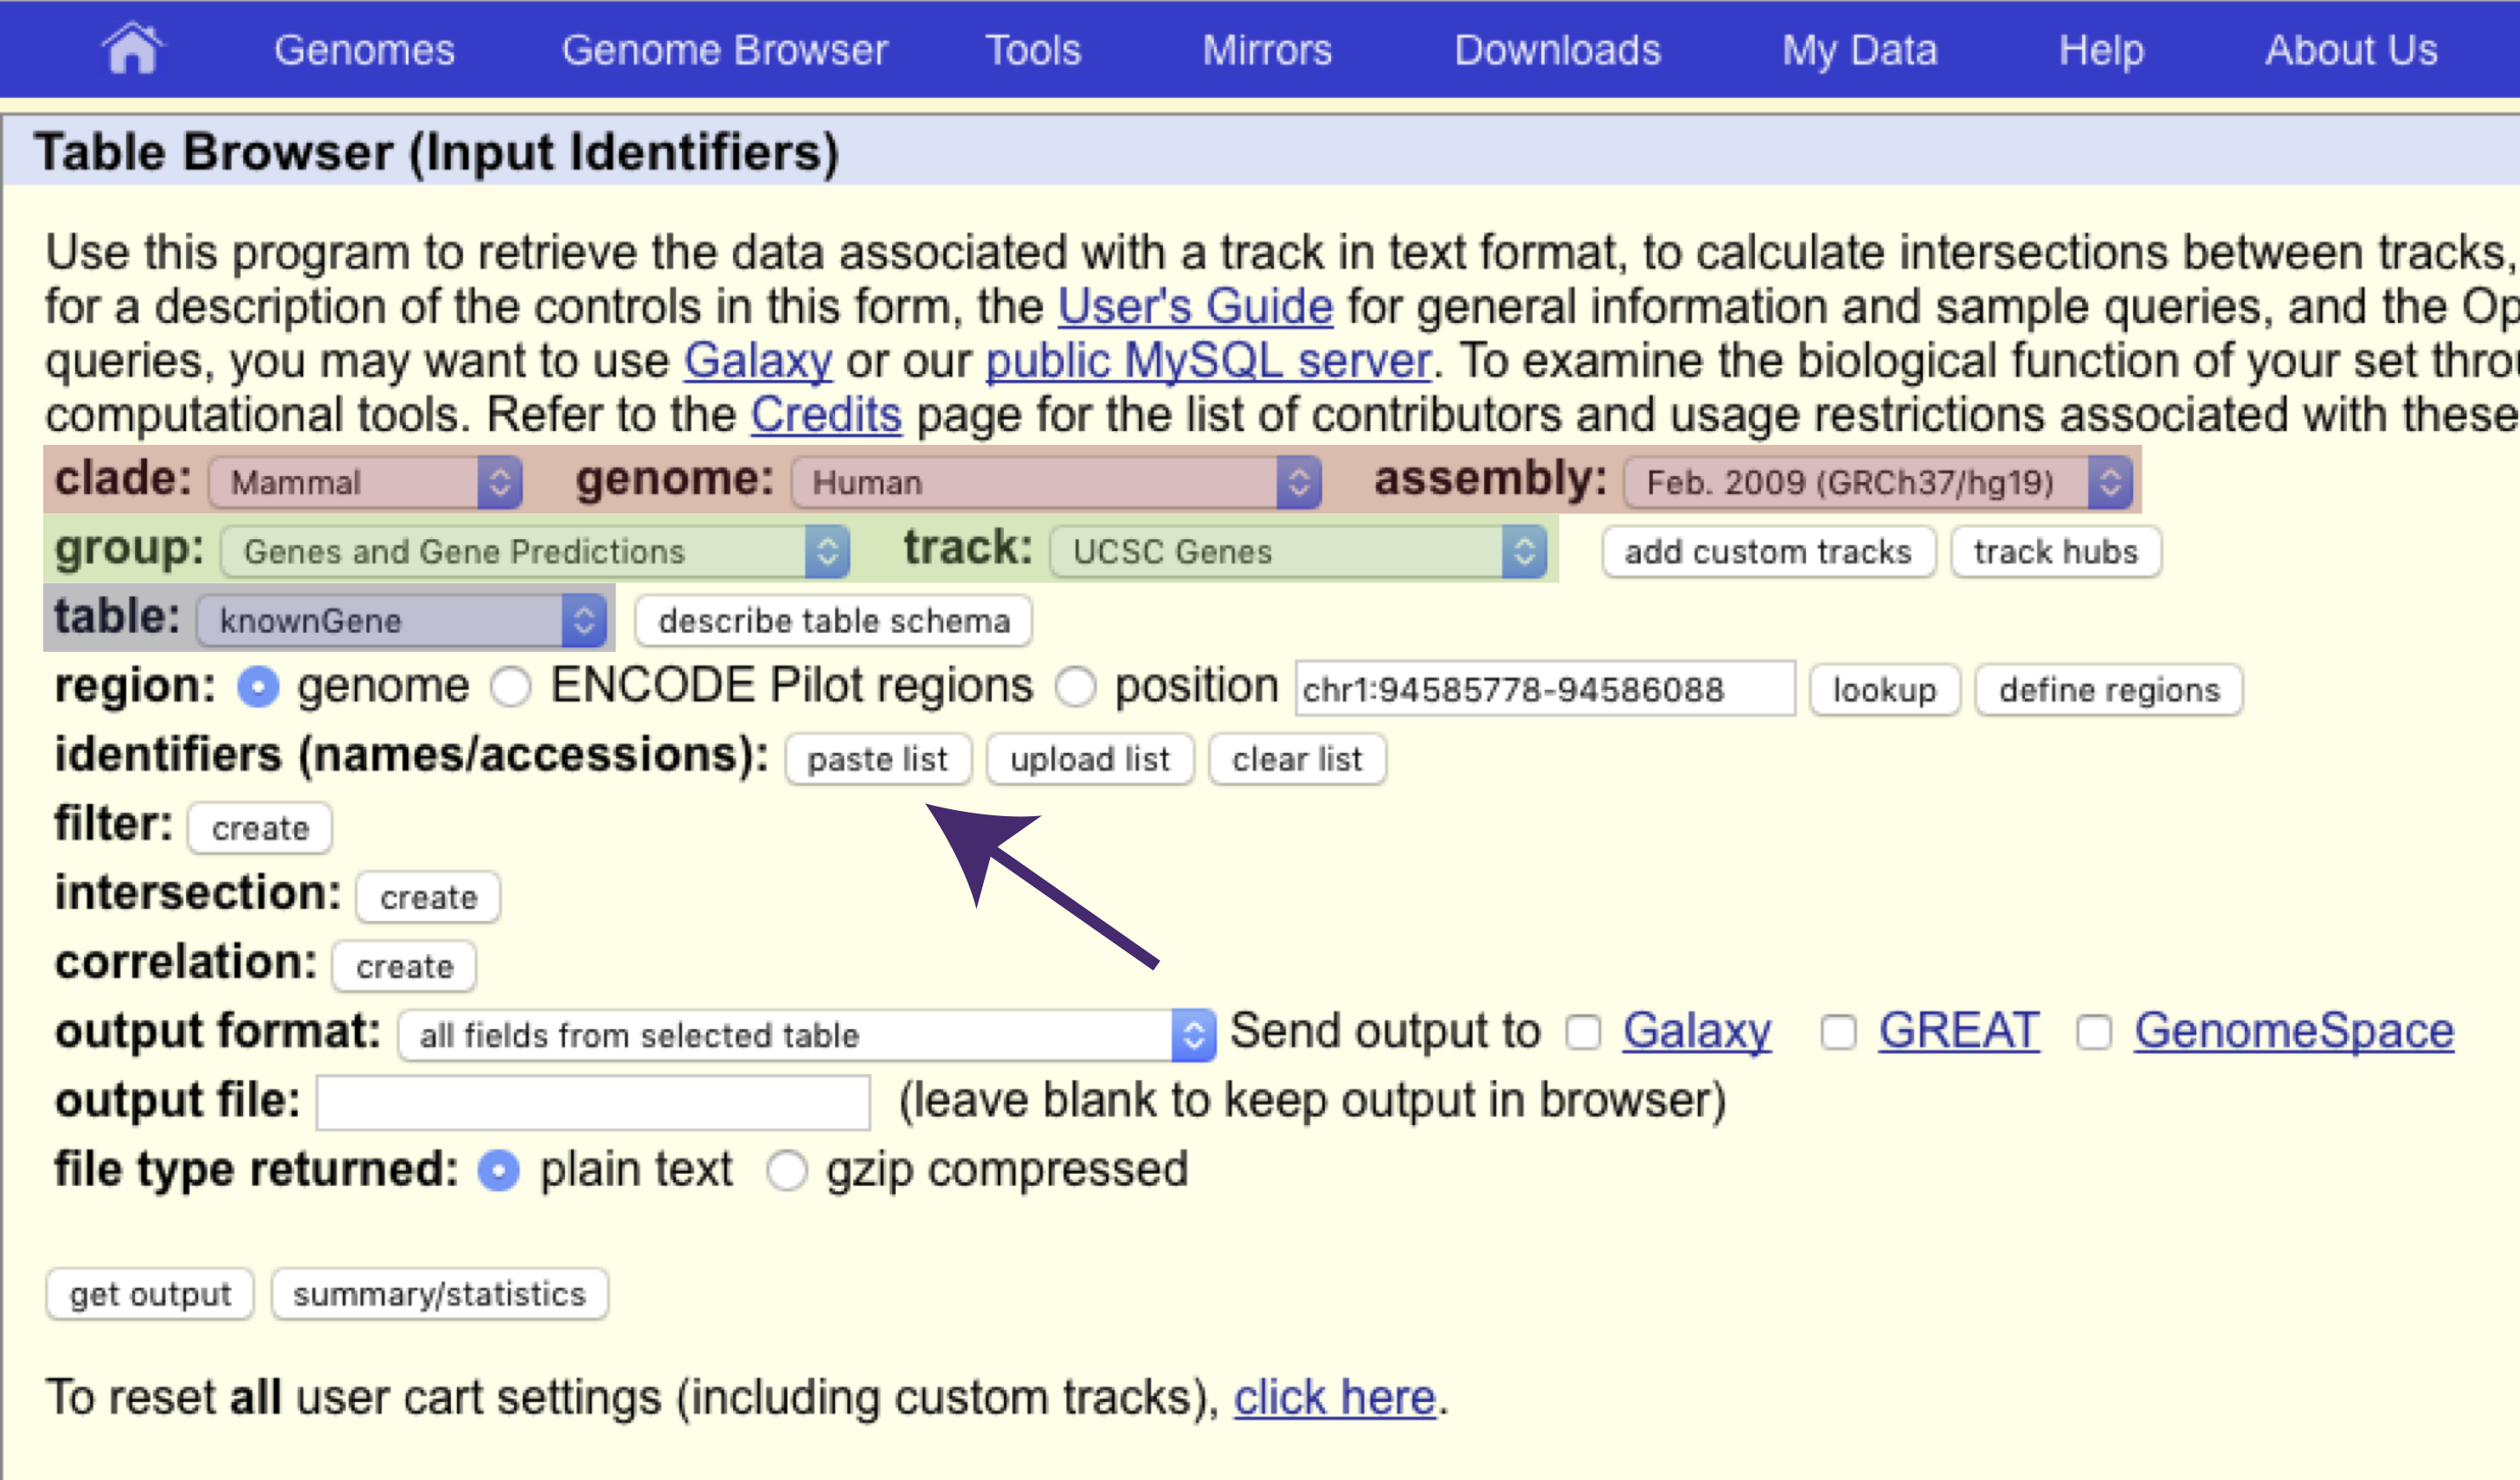
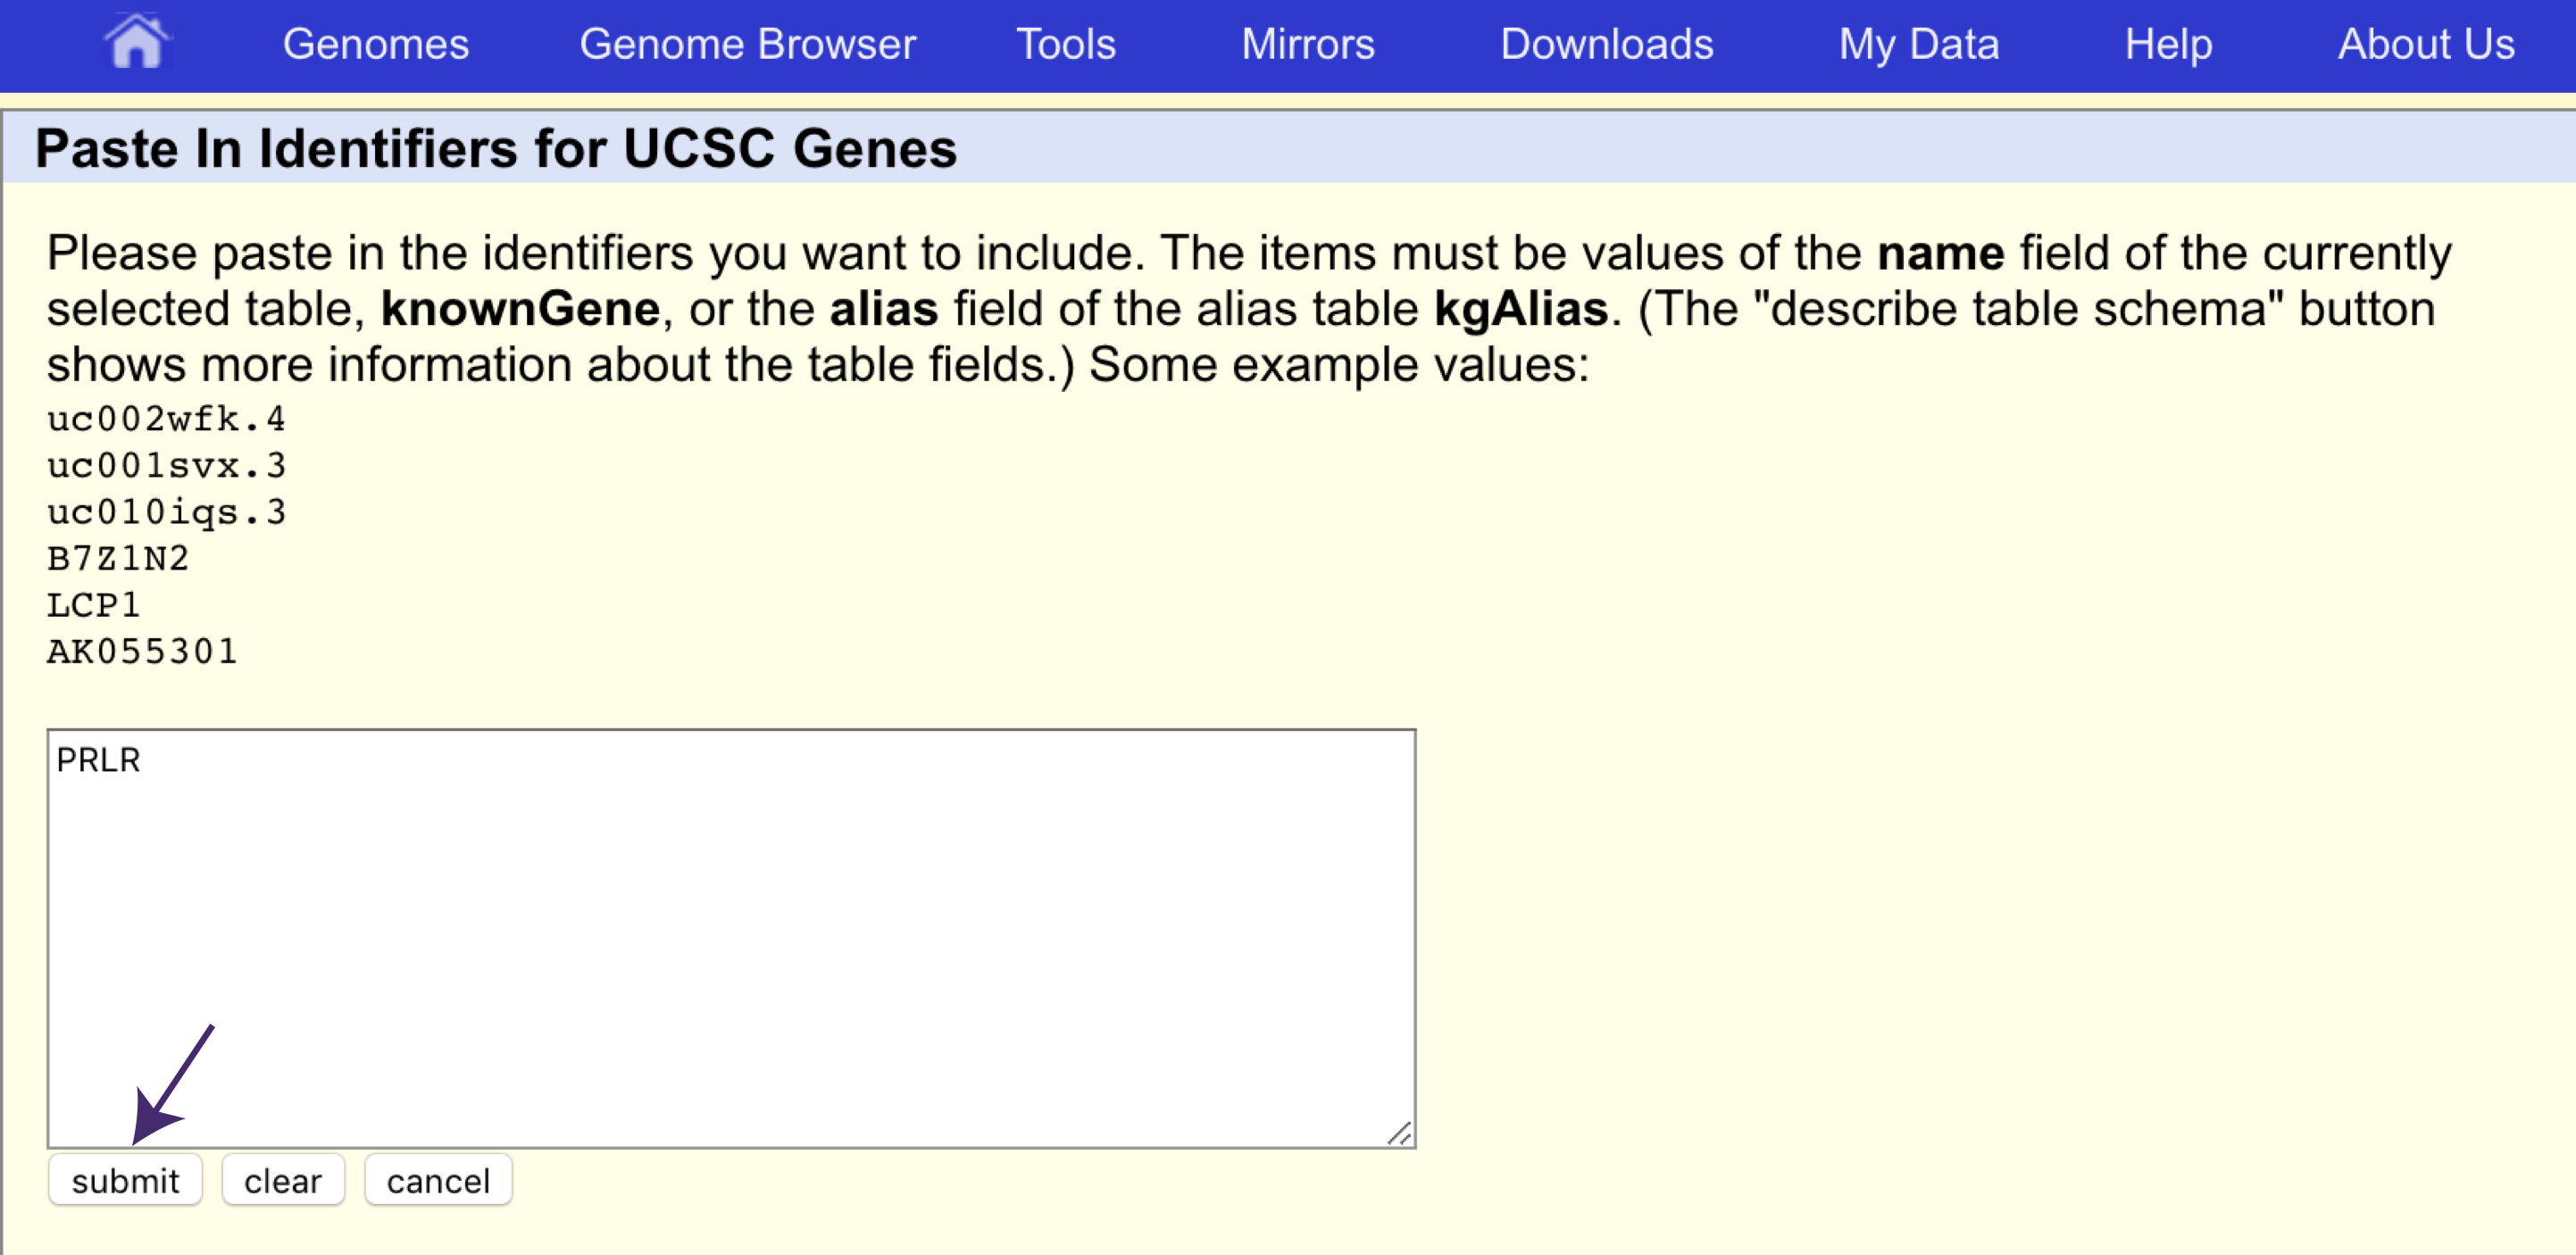
Next, click on “paste list” under “identifiers (names/accessions)” (see arrow in the figure above) and specify that PRLR is the gene we want the sequence for, and click “Submit”.
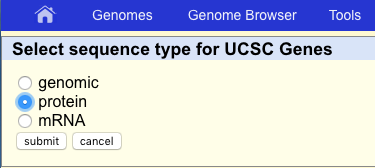
Back at the main table browser view, change the “output format” to “sequence” and click on “get output”. The table browser will ask what type of sequence we want for PRLR, let’s go ahead and get the protein sequence.
How many transcript are there for PRLR in the UCSC known genes track? Use the results from the table browser.
Answer
9
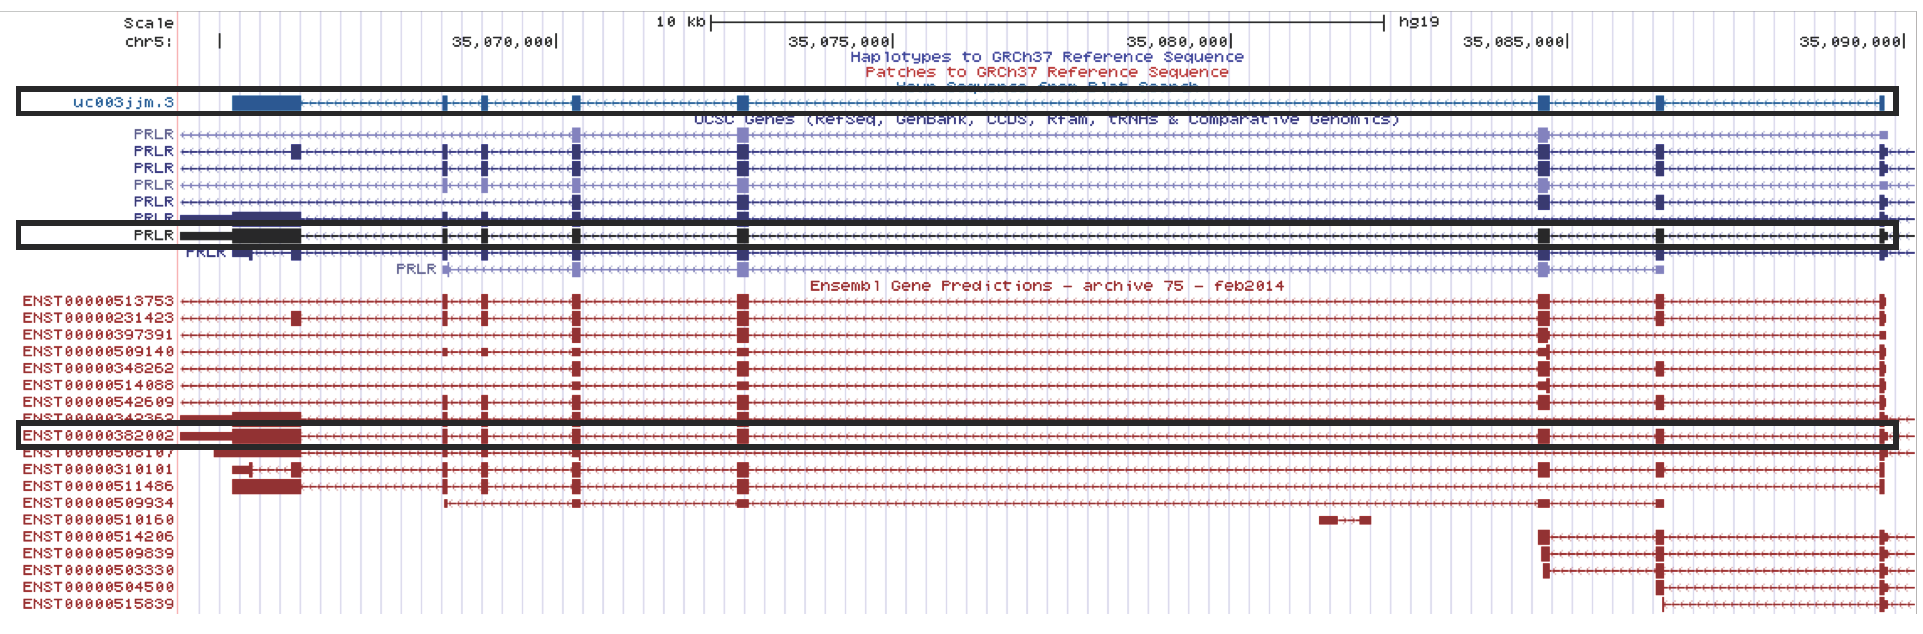
Try using BLAT on the protein sequence for entry “uc003jjm.3”. Which Ensembl transcript does this protein most closely correspond to?
Hint
Remember that since we output and BLAT aligned a protein sequence, only the protein coding part is expected to match an Ensembl transcript annotation.
Hint
You may need to zoom in to each end of the BLAT alignment to see how it lines up with the CDS/UTR boundaries of specific Ensembl transcripts.
Answer
ENST00000382002 matches the same 622 amino acid sequence of uc003jjm.3.