Genome Browsing and Visualization - Ensembl
The Ensembl Genome Browser provides a portal to sequence data, gene annotations/predictions, and other types of data hosted in the various Ensembl databases. Many consider Ensembl to be the most comprehensive and systematic gene annotation resource in the world. Ensembl supports a large number of species and makes data available through a powerful web portal as well as through direct database downloads and APIs. Their excellent Help & Documentation pages provide instruction on using the website, data access, APIs, and their procedures for gene annotation and prediction. Their outreach team have put together extensive teaching materials that are available for free online. Rather than duplicate effort, we have linked to some of their instructional videos below. We will review these and then perform some simple exercises to familiarize ourselves with the Ensembl Genome browser.
Introduction to genome browsers using Ensembl
What is a scaffold?
A scaffold is a long stretch of genomic sequence that has been assembled but not necessarily yet assigned to a chromosome. A scaffold is typically made up of contigs and gaps assembled into a single sequence with known order and orientation between the contigs.
Does Ensembl produce its own genome assembly?
No. Ensembl imports genome assemblies from other sources (e.g., the Genome Reference Consortium) and then annotates genes and other features to the same reference as available elsewhere (UCSC, NCBI, etc).
When do transcripts belong to the same gene?
Transcripts that share exons transcribed from the same strand are considered to belong to the same gene locus in Ensembl.
What are the two main types of transcripts annotated in Ensembl?
The two main types of transcripts annotated in Ensembl are (protein) coding and non-coding.
The Ensembl Genome Browser: an overview
What is a stable identifier in Ensembl?
Stable identifiers are IDs for features (gene, transcript, protein, exon, etc.) that should not change even when underlying data and meta-data for those features change. Examples include ENSG..., ENST..., ENSP... for human Ensembl gene, transcript, and proteins. Other species will have modified prefixes but follow the same conventions. For example, Ensembl dog genes are named ENSCAFG...
How many protein coding transcripts does human CDKN2B have?
Ensembl has two protein coding transcripts annotated for human CDKN2B.
Which species has a CDKN2B orthologous gene that most closely matches human?
The Chimpanzee CDKN2B is 100.00 similar to its human counterpart. This can be determined under the Comparative Genomics Gene Tree or Orthologues section of the human CDKN2B gene page.
Data Visualization with Ensembl
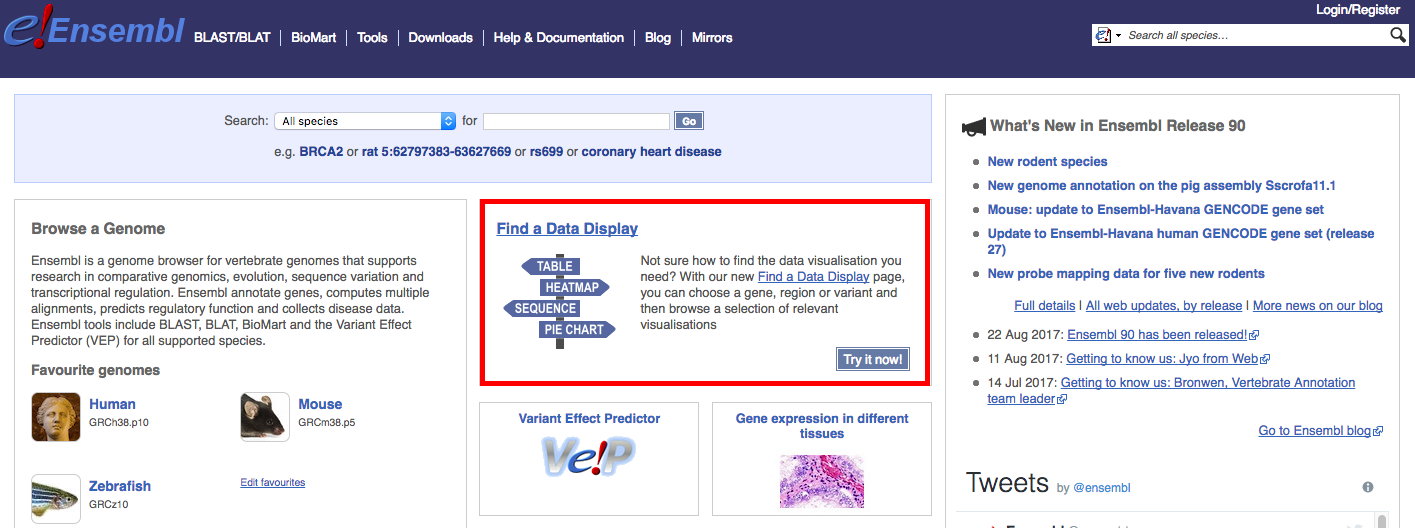
An excellent way to explore the data visualization possibilities with Ensembl is to use their Find a Data Display page. This is linked directly from the Ensembl home page (see red box below). From this page, you can you can choose a gene, region or variant and then browse a selection of relevant visualisations.
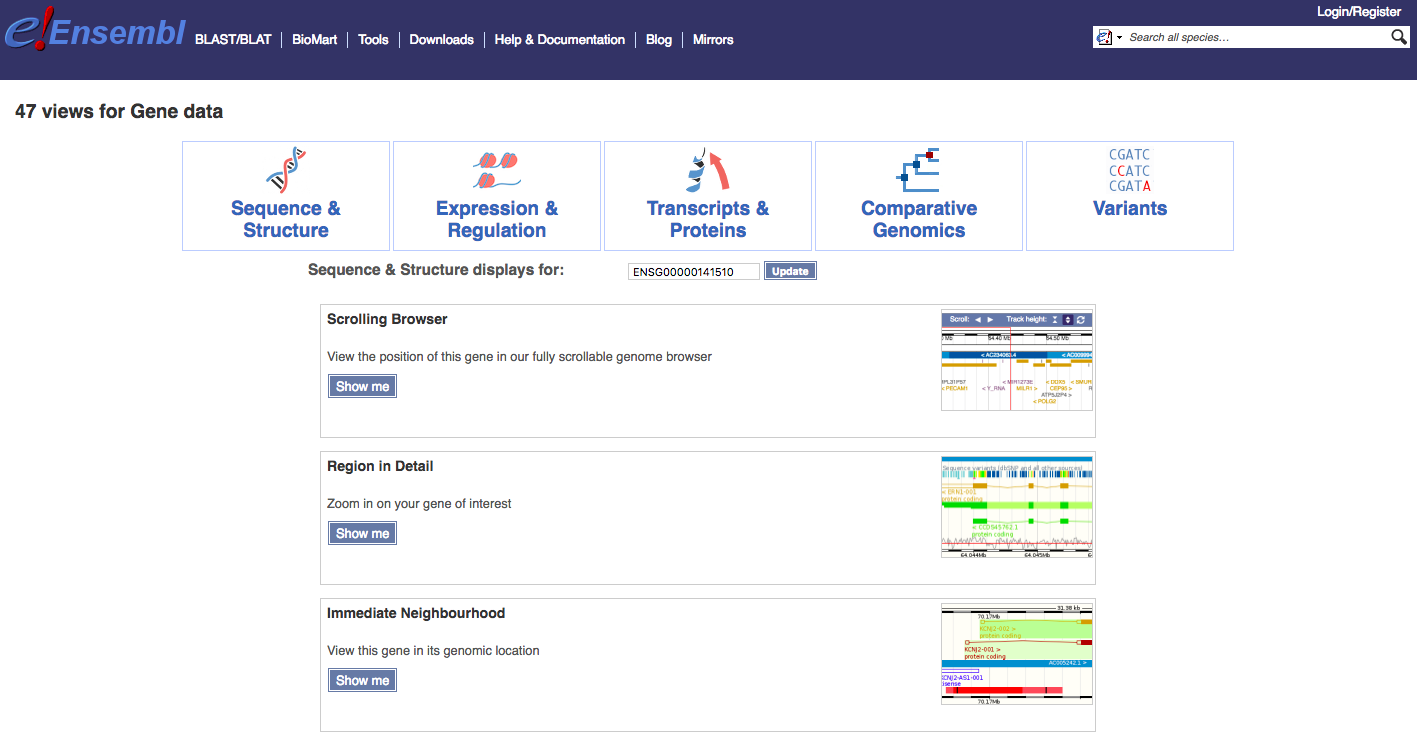
Navigate to the Find a Data Display page. To illustrate, select ‘Species’ -> ‘Human’, ‘Feature Type’ -> ‘Genes’, and then ‘Identifier’ -> ‘TP53’. You will be presented with a number of possible matches. Select the exact ‘TP53’ match and select ‘Go’. The results page, at time of writing, returned a comprehensive set of 47 views for TP53 (ENSG00000141510) associated with: Sequence & Structure, Expression & Regulation, Transcripts & Proteins, Comparative Genomics, and Variants. We will display just a few examples here and then explore others through exercises.
Select the ‘Splice Variants’ view and scroll down the page a little. You will see a graphical representation (see below) of all known and predicted transcripts for TP53, and how these exons line up with each other and with other features such as protein domains.
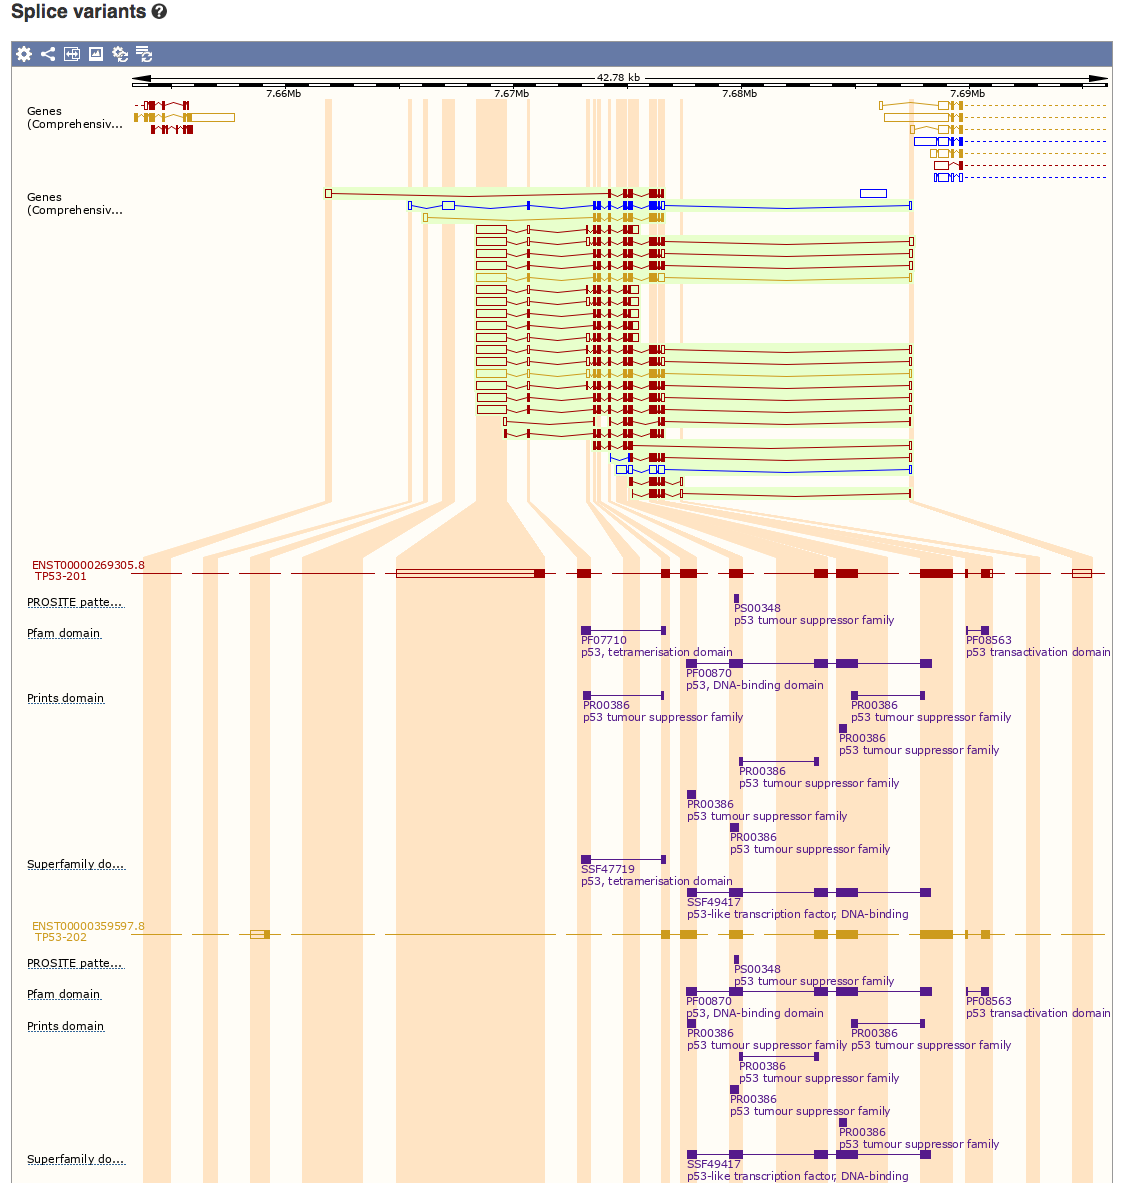
How many different protein domains are annotated for TP53 according to the Pfam database?
Pfam reports three domains for TP53: tetramerisation, DNA-binding, and transactivation domains.
Which domain is most consistently conserved across the many different isoforms of TP53?
It appears that all or part of the DNA-binding domain is the most consistently conserved across the isoforms of TP53 based solely on which exons are included in each isoform.
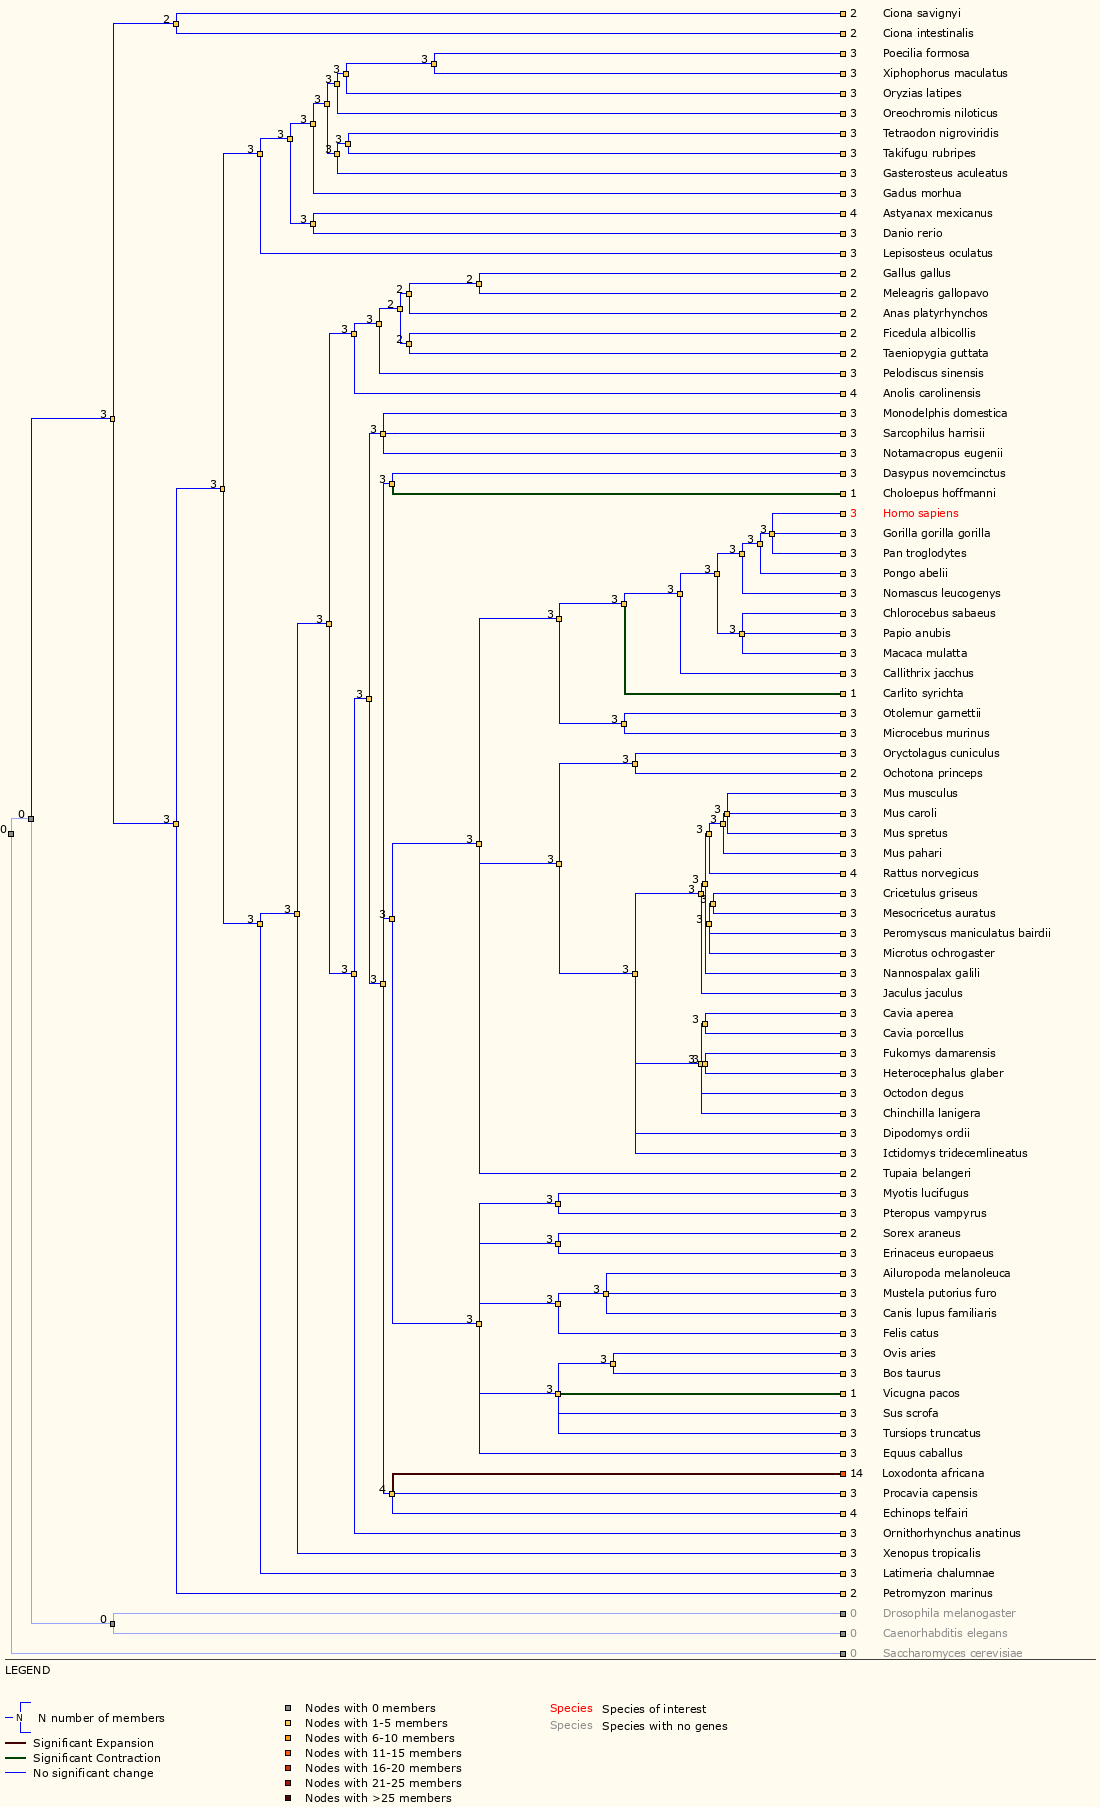
Next, examine the ‘Gene Gain/Loss Tree’ for TP53. User your browser back button (or the instructions above) to go back to the data display views for TP53 and then select ‘Gene Gain/Loss Tree’. If this does not work, you can also select ‘Gene Gain/Loss tree’ from the side bar of ‘Gene-based displays’ -> ‘Comparative Genomics’ menu on any gene page.
Which species has the most significant increase in TP53 gene?
The TP53 gene family has 14 members for elephant compared to 2, 3 or 4 for all other Ensembl species. In fact, a study in 2016 reported finding at least 20 copies of TP53 in the elephant genome and suggested that this explains why elephants do not have increased risk of cancer despite their larger body size.
Ensembl Data Display Exercise
Using your knowledge of tissue-specific expression for a specific species/gene, explore the Gene Expression views in Ensembl. Does the available data confirm your knowledge of these genes. For example, considering human genes, we might investigate: MSLN (Mesothelin) - normally present on the mesothelial cells lining the pleura, peritoneum and pericardium and over-expressed in several cancers. Other interesting human/cancer tissue markers include: KLK3 (PSA), EPCAM, SCGB2A2 (Mammaglobin), CD19, etc. Below you can see an example for PSA.
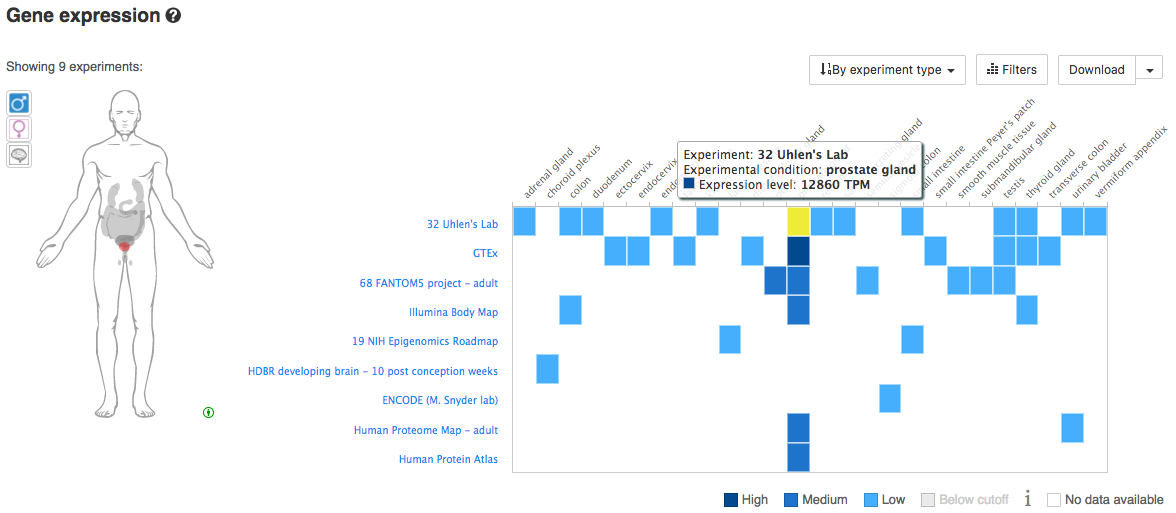
What is the tissue expession pattern for PSA?
PSA is expressly almost exclusively in the prostrate gland and only lowly in a few other tissues.
Ensembl Genomes - Extending Ensembl across the taxonomic space
The EnsemblGenomes site hosts genome-scale data from ~52,000 species, most of which are not available through the core Ensembl. Data are organized into five taxonomic categories: bacteria (n=50364), protists (n=200), fungi (n=1802), plants (n=63), and metazoa (n=74). Each generally provides at least a preliminary genome assembly, gene annotations, and to varying degrees includes: variation data, pan compara data, genome alignments, peptide alignments, and other alignments. If your species is not in Ensembl it is worth checking whether it is available in EnsemblGenomes.